
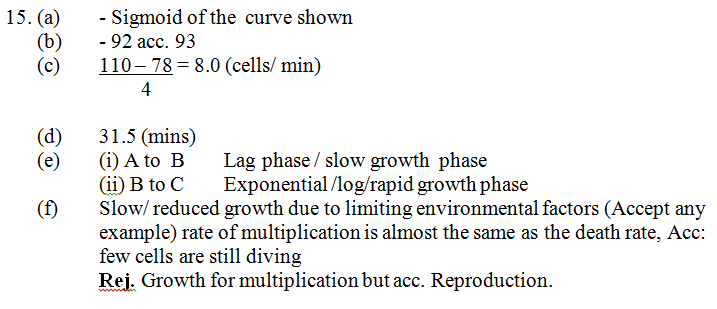
The graph below represents the increase in the number of yeast cells over a period of 48 minute: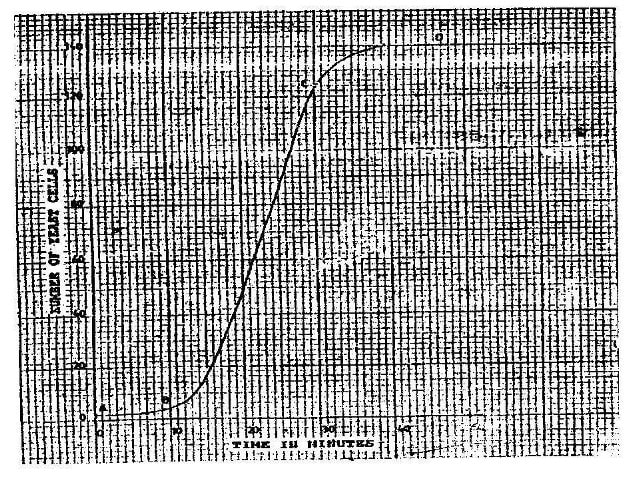
KNEC ANSWERS
(g)
(h)
0 Comments
Leave a Reply. |
Archives
December 2024
Categories
All
TOPICSFORM 1
Form 2
Form 3
Form 4
|


 RSS Feed
Can't find what you are looking for? Don't worry, Use the Search Box Below.
|
Primary Resources
College Resources
|
Secondary Resources
|
Contact Us
Manyam Franchise
P.O Box 1189 - 40200 Kisii Tel: 0728 450 424 Tel: 0738 619 279 E-mail - sales@manyamfranchise.com |