K.C.S.E Biology Q & A - MODEL 2013PP2QN06
A scientist carried out an investigation to find out the population growth of mice under laboratory conditions. Twenty young mice were placed in a cage. The results obtained from the investigation were as shown in the table below.

(a) On the grid provided, draw a graph of the number of mice against time.
GRAPH PAPER (b) Account for the changes in mice population between (i) O to 2 months (ii) 2 to 6 months (iii) 6 to 10 months (iv) 10 to 12 months. (c) (i) Between which two months was the population change greatest? (ii) Calculate the rate of population change over the period in (c)(i) above. (d) What change in population would be expected if the investigation was continued to the 19th month? (e) To obtain the observed results state two variables that were kept constant during the investigation.
answers
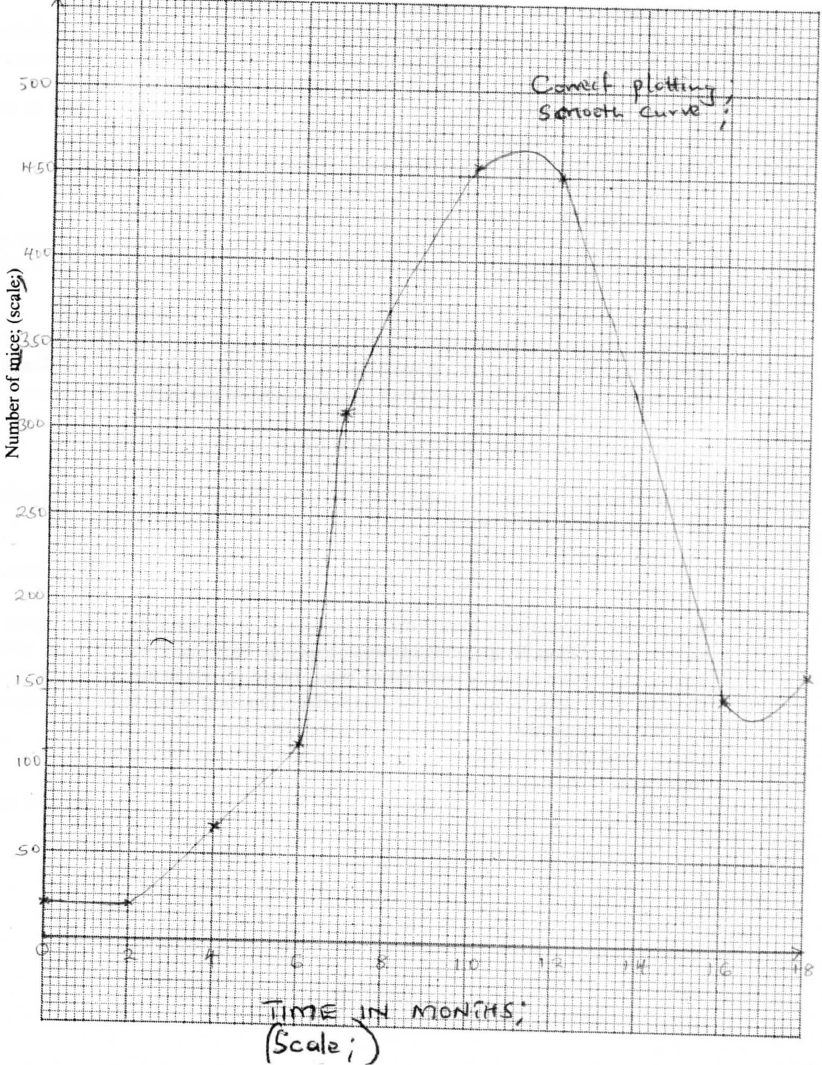
(b) (i) No change in population/population is constant: mice still maturing/have not given birth:
(ii) Slow/gradual population growth; few mice have reached sexual maturity; (iii) Faster/rapid rate of population growth/exponential; Many mice sexually matured/reproducing/enough food/space/no competition birth rate higher than death/no diseases: (iv) Population decline; Competition is high / food is limiting / space is limiting/accumulation of toxic waste/disease (outbreak) deathrate higher than birth rate. (c) (i) 6 and 8; (ii) 310-115 = 195 mice per month; (d) Population would increase; (e) Food; space ; cage size; water;
0 Comments
Leave a Reply. |
Archives
December 2024
Categories
All
TOPICSFORM 1
Form 2
Form 3
Form 4
|


 RSS Feed
Can't find what you are looking for? Don't worry, Use the Search Box Below.
|
Primary Resources
College Resources
|
Secondary Resources
|
Contact Us
Manyam Franchise
P.O Box 1189 - 40200 Kisii Tel: 0728 450 424 Tel: 0738 619 279 E-mail - sales@manyamfranchise.com |