Secondary Biology Reference Notes, Tutorials and Exercise QuestionsEnergy Flow in an EcosystemMost of the energy used in an ecosystem is derived from the sun. Solar energy is trapped by photosynthetic plants. It flows through different trophic levels and at each level energy is lost as heat to space and also through respiration. Besides animals lose energy through excretion and defecation, the amount of energy passed on as food from one trophic level to another decreases progressively. The energy in the organisms is recycled back to plants through the various nutrient or material cycles. Food Chains A food chain is a linear relationship between producers and consumers. It represents the transfer of food energy from green plants through repeated stages of eating and being eaten. Types of Food Chain
Detritivores feed on organic wastes and dead matter derived from the grazing food chain. Many different types of organisms feed on detritus, they include fungi, protozoa, insects, mites annelids and nematodes. 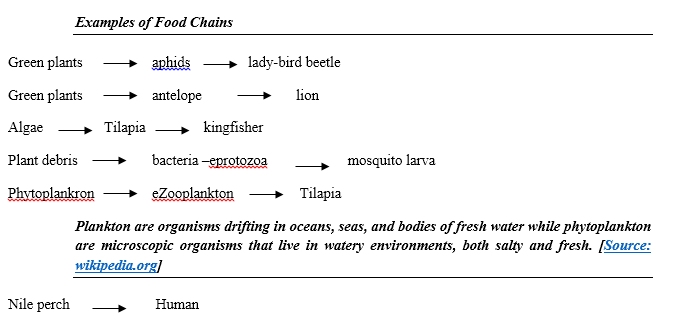 Food Web In a natural community, several food chains are interlinked to form a food web. Several herbivores may feed on one plant, similarly, a given herbivore may feed on different plants and may in turn be eaten by different carnivores. Decomposers These are mainly bacteria and fungi. These organisms feed on dead organic matter thereby causing decomposition and decay and releasing nutrients for plants. They form a link between the biotic and the abiotic components. Pyramid of Numbers Refers to the number of organisms in each trophic level presented in a graphic form and a pyramid shape is obtained. The length of each bar is drawn proportional to the number of organisms represented at that level. This is because an herbivore feeds on many green plants. One carnivore also feeds on many herbivores. In a forest the shape of the pyramid is not perfect, this is because very many small animals such as insects, rodents and birds feed on one tree. Pyramid of Biomass This is the mass of the producers and consumers at each trophic level drawn graphically. Population Estimation MethodsIt is important to find or estimate the sizes of the different populations in a habitat. Direct counting or head count which involves the counting of every individual, is not always applicable for all organisms. e.g., it is impossible to count directly the numbers of grasshoppers in an area. Different sampling methods are thus used; a sample acts as a representative of the whole population. . Sampling MethodsQuadrat Method A Quadrat is a square, made of wood’s metal/hard plastic. It can also be established on the ground using pegs, rope/permanent coloured ink, using metre rule or measuring tape. The size is usually one square metre (1M2), in grassland. In wooded or forest habitat it is usually larger, and can reach up to 20 m2 depending on particular species under investigation. The number of each species found within the quadrat is counted and recorded. Total number of organisms is then calculated by, finding the average quadrats and multiplying it with the total area of the whole habitat. The number of quadrats and their positions is determined by the type of vegetation studied. In a grassland, the quadrat frame can be thrown at random. In other habitats of forest, random numbers that determine the locus at which to establish a quadrat are used. Line Transect A line transect is a string or rope that is stretched along across the area in which all the plants that are touched are counted. It is tied on to a pole or tent peg. It is particularly useful where there is change of populations traversing through grassland, to woodland to forest land. This method can also be used in studying the changes in growth patterns in plants over a period of time. Belt Transect Two line transects are set parallel to each other to enclose a strip through the habitat to be studied. The width is determined by the type of habitat, i.e., grass or forest and by the nature of investigation. In grassland it can be 0.5 m or 1 m. Sometimes it can be 20 metres or more especially when counting large herbivores. The number of organisms within the belt is counted and recorded. Capture-recapture method This is used for animals such as fish, rodents, arthropods and birds. The animals are caught, marked, counted and released. For example, grasshoppers can be caught with a net and marked using permanent ink. After sometime, the same area is sampled again, i.e., the grasshoppers are caught again. The total number caught during the second catch is recorded. The number of marked ones is also recorded:
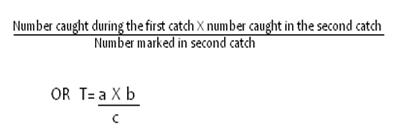 The following assumptions are made:
Density is calculated by dividing the number of organisms by the size of the area studied. Frequency: Frequency is the number of times that a species occurs in the area being studied. Percentage Cover: This is the proportion of the area covered by a particular species. For example, a given plant species may cover the whole of a given area. In this case the plant is said to have 100% cover. Dominance: This is the term used to describe a species that exerts the most effect on others. The dominance may be in terms of high frequency or high density. Adaptations of Plants to Various HabitatsOrganisms have developed structural features that enable them to live successfully in their particular habitats. Plants found beneath the canopies of trees are adapted to low light intensities by having broad leaves. Xerophytes These are plants that grow in dry habitats, i.e., in deserts and semi-deserts. They have adaptations to reduce the rate of transpiration in order to save on water consumption. Others have water storage structures. Adaptations include:
These are the ordinary land plants which grow in well-watered habitats and have no special adaptations. Stomata are found on both upper and lower leaf surfaces for efficient gaseous exchange and transpiration. However, those found in constantly wet places e.g. tropical rain forests, have features that increase transpiration. These plants are called hygrophytes. The leaves are broad to increase surface areas for transpiration and thin to ensure short distance for carbon (IV) oxide to reach photosynthetic cells and for light penetration. The stomata are raised above the epidermis to increase the rate of transpiration. They have grandular hairs or byhathodes that expel water into the saturated atmosphere. This phenomenon is called guttation. Hydrophytes (Water plants) Water plants are either submerged, emergent or floating. Submerged Plants The leaves have an epidermis with very thin walls and a delicate cuticle. They have no stomata. Water is excreted from special glands and pores at the tips. Other adaptations include the following:
Their structure is similar to that of mesophytes. The leaves are broad to increase the surface area for water loss. They have more stomata on the upper surface than on the lower surface to increase rate of water loss. Examples are Pistia sp. (water lettuce), Salvinia and Nymphea. Halophytes (Salt plants) These are plants that grow in salt marshes and on coastlines, have root cells that concentrate salts and enable them to take in water by osmosis; they also have salt glands which excrete salts. Fruits have large aerenchymatous tissues for air storage that makes them float, Some have shiny leaves to reduce water loss. The mangrove plants have roots that spread horizontally, and send some branches into the air. These aerial roots are known as breathing roots or pneumatophores. They also have lenticel-Iike openings called pneumatothodes through which gaseous exchange takes place. Effect of Pollution on Human Beings and other OrganismsPollution This is the introduction of foreign material, poisonous compounds and excess nutrients or energy to the environment in harmful proportions. Any such substance is called a pollutant. Effects and Control of causes of Pollutants in Air, Water and Soil Industrialisation and urbanisation are the main causes of pollution. As human beings exploit natural resources the delicate balance in the biosphere gets disturbed. The disturbance leads to the creation of conditions that are un-favourable to humans and other organisms. Sources of Pollutants
In most cases, chex, pical wastes from industries are discharged into water. Toxic chemicals such as mercury compounds may be ingested by organisms. Insecticides like DDT, and weedkillers eventually get into the water and contaminate it. Oil and detergents also pollute water. Excess nitrates and phosphates from sewage and fertilisers cause overgrowth of algae and bacteria in water. This is called eutrophication. As a result there is insufficient oxygen which causes the deaths of animals in the water. Air pollution: Smoke from industries and motor vehicles contains poisonous chemicals like carbon (II) oxide, carbon (IV) oxide, sulphur (IV) oxide and oxides of nitrogen. When sulphur (IV) oxide and oxides of nitrogen dissolve in rain, they fall as acid rain. Accumulation of carbon (IV) oxide in the atmosphere causes the infrared light to be confined within the atmosphere, the earth's temperature rises. This is called the greenhouse effect. Carbon particles in smoke coat the leaves of plants and hinder gaseous exchange and photosynthesis. The particles also form smog in the air. Lead compounds are from vehicle exhaust pipes. All these have negative effects on man and the environment. Soil/Land pollution: Plastics and other man-made materials are biologically non-degradable i.e they are not acted upon by micro-organisms. Scrap metal and slag from mines also pollute land. Failure to rehabilitate mines and quarries also pollute land. Effects of Pollutants to Humans and other organisms
0 Comments
Leave a Reply. |
Archives
January 2024
Categories
All
|
 RSS Feed
Can't find what you are looking for? Don't worry, Use the Search Box Below.
|
Primary Resources
College Resources
|
Secondary Resources
|
Contact Us
Manyam Franchise
P.O Box 1189 - 40200 Kisii Tel: 0728 450 424 Tel: 0738 619 279 E-mail - sales@manyamfranchise.com |