KCSE MATHEMATICS QUESTIONS AND SOLUTIONS ~ Topically Analyzed
Comprehensive Answers and Marking Schemes KNEC Certified
Form 3 Mathematics
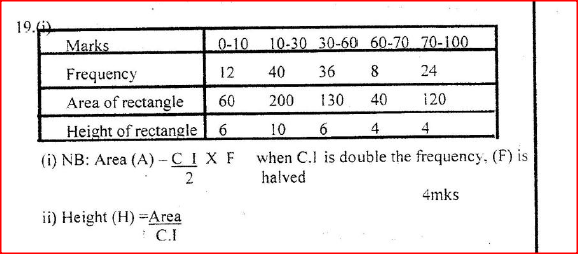
A frequency distribution of marks obtained by 120 candidates is to be represented in a histogram. The table below shows the grouped marks. Frequencies for all the groups and also the area and height of the rectangle for the group 30 – 60 marks.

(a) (i) Complete the table
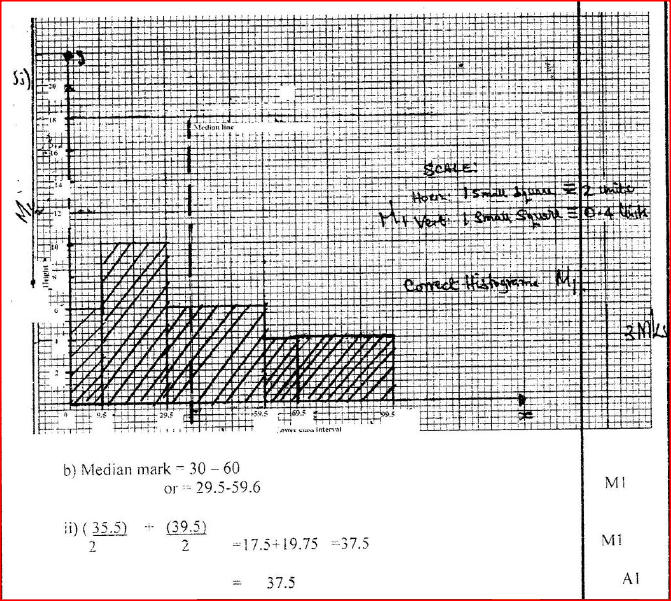
(ii) On the grid provided below, draw the histogram (b) (i) State the group in which the median mark lies (ii) A vertical line drawn through the median mark divides the total area of the histogram into two equal parts Using this information or otherwise, estimate the median mark
answers
0 Comments
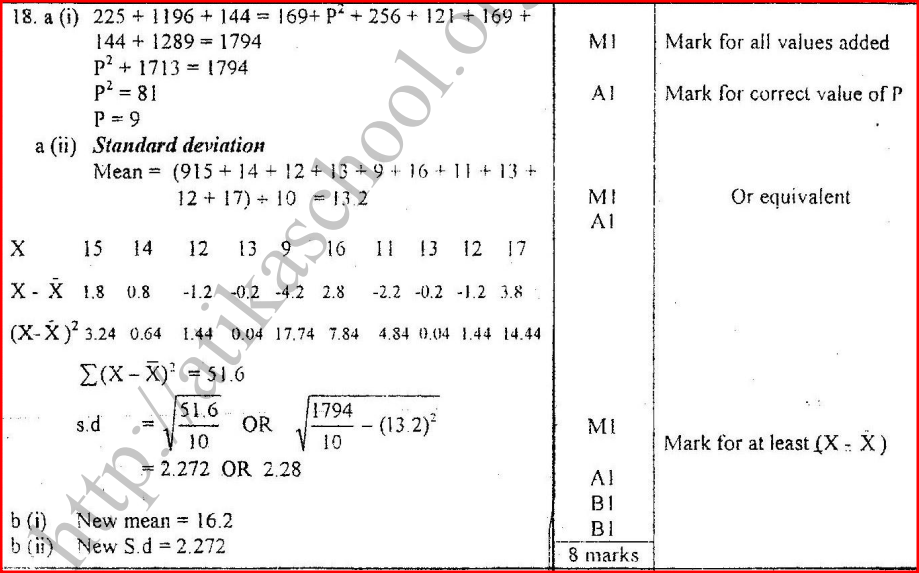
Form 2 MathematicsThe marks obtained by 10 pupils in an English test were 15,14,13,12,P,16,11,13,12 and 17.The sum of the squares of the marks, ∑x = 21,794
Answer
Form 2 Mathematics
The frequency distribution table below shows the weekly salary (K£) paid to workers in a factory
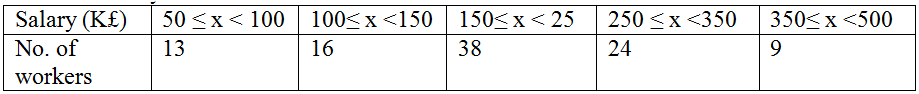
On the grid provided draw a histogram to respect the information shown above
Answer*
Form 2 Mathematics | Topical Questions and Answers
The table below shows heights of 50 students
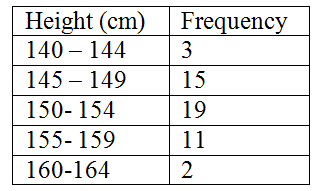
ANSWER

Form 2 Mathematics
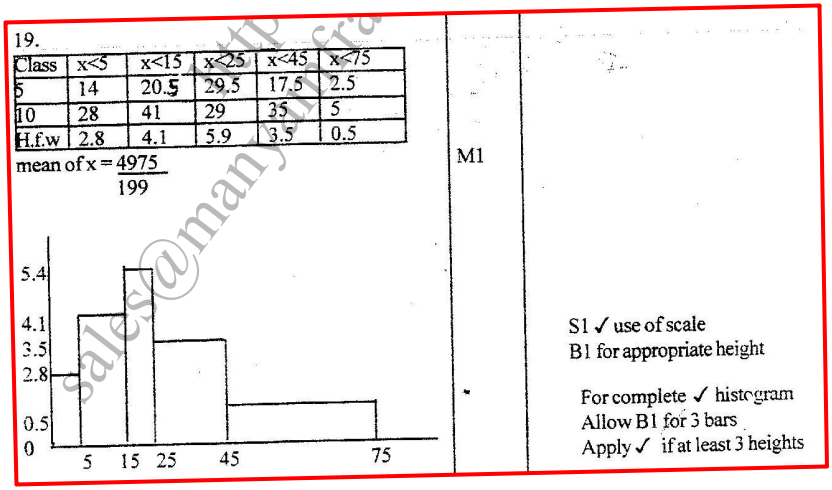
Patients who attend a clinic in one week were grouped by age as shown in the table below:
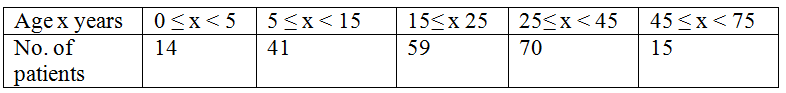
Answer
Form 1 Mathematics
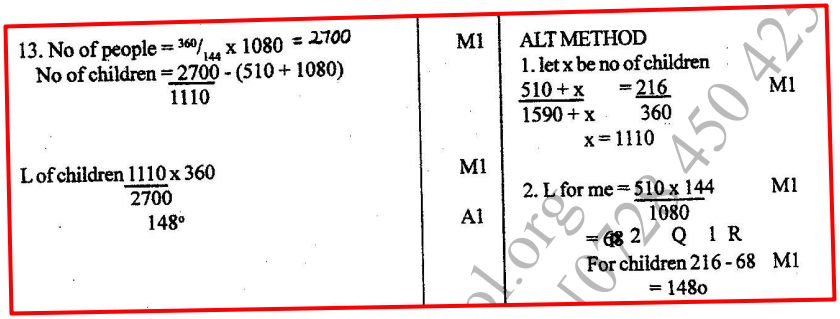
The number of people who attended an agricultural show in one day was 510 men, 1080 women and some children. When the information was represented on a pie chart, the combined angle for the men and children was 2160. Find the angle representing the children.
answer
 Six weeks after planting the height of bean plants were measured correct to the nearest centimeter. The frequency distribution is given in the table below.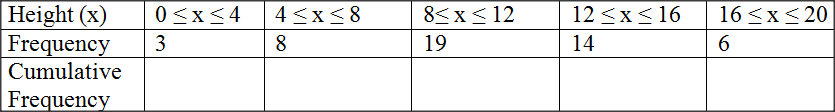
answer

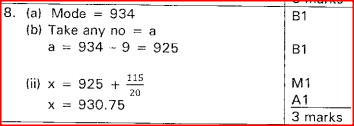
The following enrollment figures for twenty primary schools were collected.934 923 936 924 933 933 937 926 923 934 931 929 934 927 932 934 927 940
K.N.E.C Marking Scheme
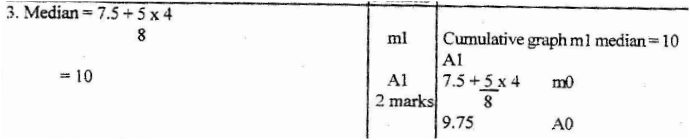
 Estimate the median absentee rate per week in the school MARKING SCHEME
2 MARKS |

Categories
All
Archives
December 2024
Latest Posts |
|
Primary Resources
College Resources
|
Secondary Resources
|
Contact Us
Manyam Franchise
P.O Box 1189 - 40200 Kisii Tel: 0728 450 424 Tel: 0738 619 279 E-mail - sales@manyamfranchise.com |
 RSS Feed