|
1. 1989 Q4 P1
State how excessive use of pesticides may affect soil fertility 2. 1989 Q8 P1 The table below shows a list of five human diseases. Complete the table by naming the causative agent of each. The first one has been completed for you. 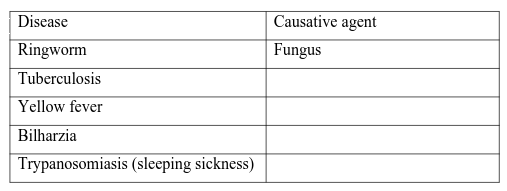
Human Diseases
3. 1989 Q15 P1
The graph below represents a population growth of a certain herbivore in grassland ecosystem over a period of time 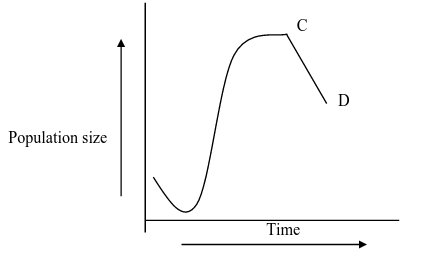
population growth
Suggest three factors that could have caused the population change between C and D.
4. 1989 Q17 P1 A biologist carried out a study to investigate the growth of a certain species of herbivorous bony fish and the factors influencing plant and animal life in four small lakes A, B, C, and D. The lakes were located in the same Geographical areas. Two of the lakes A and B were found to contain hard water due to presence of high contents of calcium salts. The mean bodies lengths of 2 year old fish, amount of plant life and investigate biomass in each lake were determined. The data was as shown in the table below. 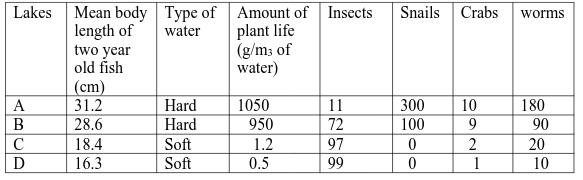
growth
(a) Describe the procedure that may have been used to determine the mean body length of the fish.
(b) What were the likely reasons for the difference in the mean body length of the fish living in lakes A and D? (c) Suggest one reason for the absence of snails in lake C and D. (d) (i) Name any six abiotic (physical) factors that are likely to influence the plant and animal in life in Lake A. (ii) Explain how each of the factors named in (d) (i) above may influence the plant and animal life in Lake A. 5. 1990 Q6 P1 Which of the following diseases that affect man are caused by viruses
An investigation was carried out between 1964 and 1973 to study the changes of fish population in a certain small lake. Four species of fish A, B, O and D were found to live in this lake. In 1965, a factory was built near the lake and was found to discharge hot water in to lake raising the average temperature from 25oC to 30oC diverted into the lake. In 1969, discharge of hot water, sewage and industrial waste into the lake was stopped. The fish populations during the period of investigation are shown in the table below. 
(a) (i) In which year were the fish population lowest?
(ii) State the factors that might have caused the lowest fish population during the year you have stated in (a) (i) above. (iii) Explain how each factor you have state in (a) (ii) above could have brought about the changes in fish populations. (b) (i) What is the difference in the rate of population recovery of species A and D? (ii) Suggest two biological factors that could have led to this difference. (c) (i) State a method that might have been used in estimating fish populations in the lake. (ii) State one disadvantage of the method that you have stated in (c) (i) above 7. 1991 Q7 P1 State two roles of green plants in a fish aquarium other than providing food for fish. 8. 1991 Q8 P1 State two precautionary measures which should be taken in preventing an outbreak of cholera. 9. 1991 Q10 P1 With reference to leaf structure only. Explain FIVE ways by which plants are adapted to living in arid areas. 10. 1992 Q3 P1 Name a water-borne disease and state a control measure for it. 11. 1993 Q3 P1 What is the biological reason for spreading oil on stagnant water in the control of malaria? 12. 1993 Q8 P1 Name the disease caused by each of the following organisms. (a) Wuchereria bancrofti (Filarial worm) (b) Phytophthora infestans 13. 1993 Q15 P1 The diagram below represents a section through a leaf of a terrestrial plant. 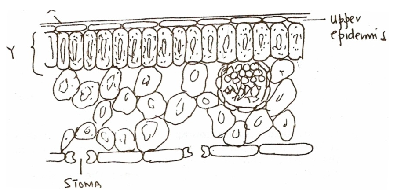
a section through a leaf of a terrestrial plant.
(a) Explain two ways in which structures labeled X and Y are adapted to their function
(b) State the difference that would be observed between the above section and one obtained from the plant growing in fresh water habitat 14. 1993 Q19 P1 (a) Explain how food as a factor regulates the population of animals in an ecosystem. (b) Describe the flow of energy from the sun through the different tropic levels in an ecosystem 15. 1994 Q5 P1 Explain why the biomass of primary producers is greater than that of primary consumers in a balanced ecosystem. 16. 1994 Q19 P1 (a) What is pollution? (b) State the cause and the methods of controlling pollution of ;- i. Air ii. Water 17. 1995 Q13 P1 The chart below shows a feeding relationship in a certain ecosystem 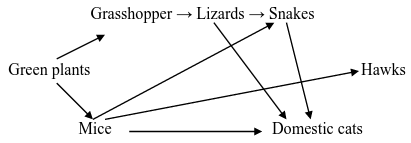
feeding relationship
(a) Construct two food chains ending with a tertiary consumer in each case (2 marks)
(b) Which organism has the largest variety of predators in the food web? (1 mark) (c) Name secondary consumers in food web (2 marks) (d) Suggest three ways in which the ecosystem would be affected in there was a prolonged drought. 18. 1996 Q15 P1 To estimate the population size of crabs in a certain lagoon, traps were laid at random. 400 crabs were caught, marked and released back into the lagoon. Four days later, traps were laid again and crabs were caught. Out of the 374 crabs, 80 were found to be marked. (a) Calculate the population size of the crabs in the lagoon using the formula below 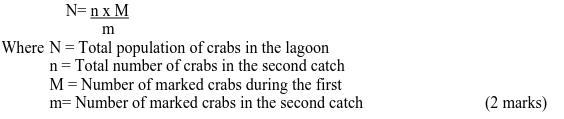
(b) State two assumptions that were made during the investigation (2 marks)
(c) What is the name given to this method of estimating the population size 19. 1996 Q20 P1 A culture of bacteria was incubated in nutrient agar at 350C. Samples were taken at intervals in order to estimate the number of bacteria in the population. The data obtained is shown in the graph below. 
(a) When was the pollution of bacteria 350 million
(b) Account for the shape of the graph between (i) A and B (ii) B and C (iii) C and D (c) Give three reasons for the shape of the curve between D and E (d) (i) Suggest what would happen to the population of the bacteria if the temperature was lowered to 0 degrees after incubating for 12 hours. (ii) Give a reason for your answer in (d) (i) above (e) Give three reasons why it is important to control human population growth rate in Kenya? 20. 1997 Q6 P1 Oil can be applied on the stagnant water to control the spread of malaria. (a) How does this practice control the spread of malaria? (b) Give a reason why this practice should be discouraged 21. 1997 Q11 P1 The following below represents a feeding relationship in an ecosystem 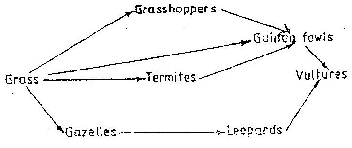
feeding relationship
(a) Write down the food chains in which the guinea fowls are secondary consumers
(b) What would be the short term effects on the ecosystem if lions invaded the area? (c) Name the organism through which energy from the sun enters the food web. 22. 1997 Q14 P1 The diagram below represents a simplified nitrogen cycle. 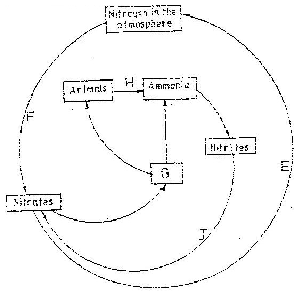
simplified nitrogen cycle.
(a) Name the organisms that cause process E and J
E…………………………………………………… J…………………………………………………….. (b) Name the process represented by F and H. F………………………………………………….. H…………………………………………………. (c) Name the group of organism represented by G 23. 1997 Q19 P1 (a) What is parasitism? (b) Describe how the tapeworm is adapted to a parasitic mode of life 24. 1998 Q5 P1 What is the relationship between leguminous plants and bacteria found in their root modules? 25. 1998 Q10 P1 Give two reasons why primary productivity in an aquatic ecosystem decreases with depth. 26. 1998 Q15 P1 The herbivorous mammalian species were introduced into an ecosystem at the same time and in equal numbers. The graph below represents their populations during the first seven years. Study the graph and answer the questions that follow. 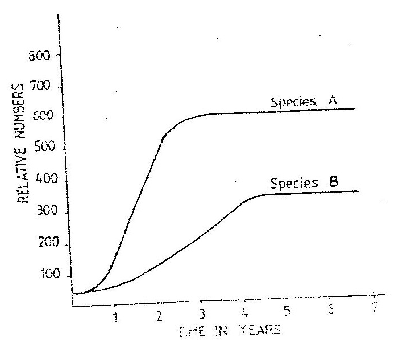
(a) (i) Which species has a better competitive ability?
(ii) Give reason for your answer (b) Account for the shape of the curve species A between (i) One year and three years (ii) Three years and seven years (c) A natural predator for species A was introduced into the ecosystem. With a reason state how the population of each species would be affected. 27. 1999 Q13 P1 a) Distinguish between a community and population. b) Describe how population of grasshoppers in a given area can be estimated. 28. 1999 Q17 P1 Explain how the various activities of man have caused pollution of air. 29. 2000 Q2 P1 Give a reason why two species in ecosystems cannot occupy the same niche. 30. 2000 Q10 P1 Explain how birds of prey are adapted to obtaining their food. 31. 2000 Q14 P1 (a) Name the crop infested by phytophthora infestans and the disease it causes (b) State four control measures against the disease 32. 2000 Q17 P1 The numbers of different types of animals supported by a square kilometer in two terrestrial ecosystems are shown in the table below 
(a) (i) Which domestic animal is better adapted to both ecosystems?
(ii) Give a reason why the animal named in (a) (i) above is better adapted to the two ecosystems. (b) Why are cattle and sheep fewer in the bush land than in the savannah? (c) (i) Name suitable methods that were used to estimate the population of: Domestic animals Wild animals (ii) Give a reason why the method named for wild animals in (c) (i) above is suitable (d) State three methods which could be used to determine the diet of wild animals in an ecosystem (e) Name four biotic factors that could have regulated the animal population in both ecosystems (f) State four human activities that affect population of animals in game parks (g) What is the importance of national park to a nation? 33. 2000 Q19 P1 How are leaves of mesophytes suited to their functions? 34. 2001 Q2 P1 Why are green plants referred to as primary producers in an ecosystem? 35. 2001 Q13 P1 The diagram below represents the nitrogen cycle 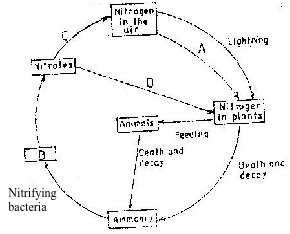
nitrogen cycle
(a) State the process labeled
A………………………………………………………………. D………………………………………………………………. (b) Name the compound represented by B (c) Name the group of organisms labeled C (d) (i) name the group of plants which promote process A (ii) State the part of the plant where process A takes place (e) How would excess pesticides in the soil interfere with process A 36. 2002 Q2 P1 a) Name the bacteria found in the root nodules of leguminous plant b) State the association of the bacteria named in (a) above with the leguminous plants. 37. 2002 Q7 P1 Explain why the carrying of wild animals is higher than that for cattle in a given piece of land. 38. 2002 Q12 P1 The chart below represents a simplified carbon cycle. 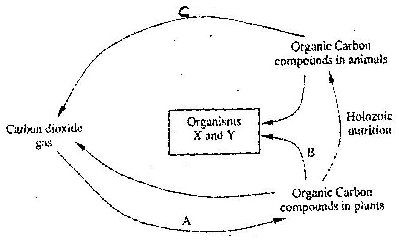
carbon cycle
(a)Name the process labeled A, B, and C
A……………………………………………………….. B……………………………………………………….. C………………………………………………………….. (b) Name the organisms X and Y X……………………………………………………. Y…………………………………………………… (c) State the importance of carbon cycle in nature 39. 2002 Q15 P1 Ascaris lumbricoides in an example for an endo – parasite a) The name Ascaris refers to b) State the habitat of the organism c) State three ways in which the organism is adapted to living in its habitat. 40. 2003 Q4 P1 a) Name the bacteria found in root nodules of leguminous plants. b) What is the role of the bacteria named in (a) above? 41. 2003 Q10 P1 How are leaves of submerged adapted plants for photosynthesis? 42. 2003 Q11 P1 Name the causative agent of typhoid. 43. 2003 Q16 P1 a) What is meant by: i) Autecology ii) Synecology? b) The number and distribution of stomata on three different leaves are shown in the table below: 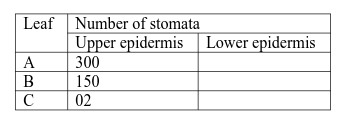
Suggest the possible habitat of the plants from which the leaves were obtained
Leaf Habitat A ………………………………………………… B …………………………………………………. C …………………………………………………. (c) State the modifications found in the stomata of leaf C. 44. 2004 Q19 P1 Explain how a biotic factors affect plants (20mks) 45. 2005 Q10 P1 Name the organism that causes amoebic dysentery. (1mark) 46. 2005 Q16 P1 a)Name two organisms that cause food spoilage (2marks) b) Name two modern methods of food preservation and for each state the biologic principle behind it. (4 marks) 47. 2005 Q17 P1 After an ecological study of feeding relationships students constructed the food web below. 
What is the importance of the following in an ecosystem? (2marks) a) Decomposers b) Predation 49. 2006 Q26 P1 The chart below represents a simplified nitrogen cycle. 
What is represented by X, Y, and Z?
X……………………………………………………… Y……………………………………………………… Z……………………………………………………… 50. 2006 Q3 P2 a) Distinguish between pyramid of numbers and pyramid of biomass. (2marks) b) Give three reasons for loss of energy from one trophic level to another in the food chain. (3marks) 51. 2007 Q15 P1 (a) Distinguish between population and community (2 marks) (b) Name a method that could be used to estimate the population size of the following organisms (i) Fish in a pond (1 mark) (ii) Black jack in a garden (1mark) 52. 2007 Q16 P1 State two ways in which schritosoma species is adapted to parasitic mode of life 53. 2007 Q8 P2 Describe causes and methods of controlling water pollution (20 marks) 54. 2008 Q3 P1 (a) Name a disease of the liver whose symptom is jaundice (1 mark) (b) State the causative agent of: (i) Cholera (1 mark) (ii) Candidiasis (1 mark) 55. 2008 Q14 P1 Describe the three characteristics of a population (3 marks) 56. 2008 Q7 P2 Describe the nitrogen cycle (20 marks) 57. 2009 Q2 P1 Name two benefits that a parasite derives from the host (2 marks) 58. 2009 Q9 P1 (a) Name the causative agents of the following diseases in humans (2 marks) (ii) Amoebic dysentery (b) Name the disease in humans caused by plasmodium falciparum (1 mark) (i) Typhoid 59. 2009 Q19 P1 (a) State three effects of dumping untreated sewage into a river (3 marks) (b) Name one process that is responsible for loss of energy from one trophic level to the next (1mark) 60. 2009 Q20 P1 Other than using the quadratic, give two methods of estimating population of grass 61. 2009 Q3 P2 (a) What is meant by the term biological control (1 mark) i) Give an example of biological control (1 mark) (b) (i) What is eutrophication? (3 marks) (ii) What are the effects of eutrophication (3 marks) (c) Name a substance that is responsible for acid rain (1 mark) 62. 2010 Q13 P1 What is meant by the following term? a) Habitat; (1 mark) b) Ecosystem (1 mark) 63. 2010 Q25 P1 State three factors that contribute to the deceleration phase in the population curve of an organism (1 mark) 64. 2010 Q3 P2 The diagram below represents a food web in certain ecosystem 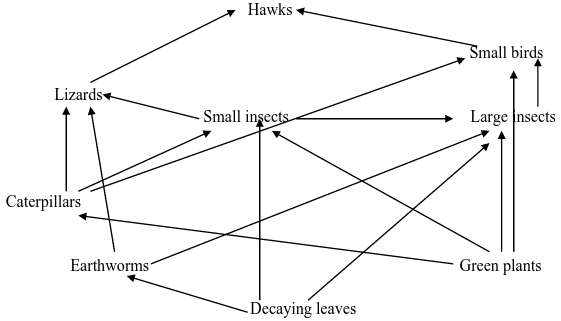
a) Name the trophic level occupied by each of the following:
i) Caterpillars (1 mark) ii) Small insect. (1 mark) b) From the food web, construct two food chains which end with lizards as a tertiary consumer. (2 marks) c) i) Which organisms have the least biomass in this ecosystem? (1 mark) ii) Explain the answer in (c)(i) above. 65. 2011 Q5 P1 The figure below illustrates a food web in a certain ecosystem. 
From the food web:
a) Draw the shortest food chain; (1 mark) b) Identify the organisms with the highest i) number of predators; ( 1 mark) ii) biomass ( 1 mark) What is meant by the following terms? a) Ecology (1 mark) b) Carrying capacity (1 mark) How are the pneumatophores adapted to their function? (2 marks) The table below shows results of a study of three plants C, D and E growing in different habitats 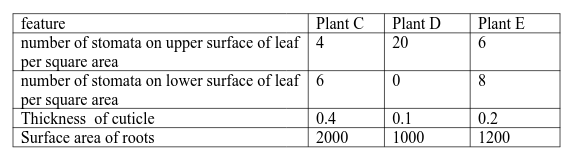
Name the process through which free atmospheric nitrogen is converted into nitrates. (1mark) 70. 2012 Q6 P2 The data provided below represent populations of a predator and its prey over a fifty years period. 
6 Comments
joel
22/4/2016 10:56:45
may i get the ansers
john amukoa
28/4/2016 15:25:44
poa poa
chazima Benson
26/9/2016 21:04:10
Good job
Maz
23/4/2024 16:51:05
Hey
Mary ndiritu
23/4/2024 16:50:18
Answers ziko fiti Leave a Reply. |
Archives
December 2024
Categories
All
TOPICSFORM 1
Form 2
Form 3
Form 4
|


 RSS Feed