K.C.S.E Biology Q & A - MODEL 2007PP2QN06
In the experiment to determine the effect of ringing on the concentration of sugar in phloem a ring of bark from the stem of a tree was cut and removed. The amount of sugar in grammes per 16cm3 piece of bark above the ring was measured over a 24 hour period. Sugar was also measured in the bark of a similar stem of a tree which was not ringed. The results are shown in the table below.
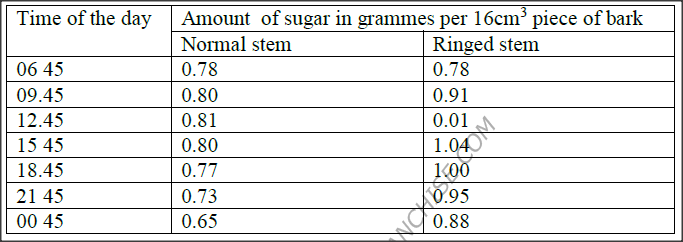
(a) Using the same axes, plot a graph of the amount of sugar against time
(b) At what time was the amount of sugar highest in the (i) Ringed stem (ii) Normal stem? (c) How much sugar would be in the ringed stem if it was measured at 0345hours? (d) Give reasons why there was sugar in the stems of both trees at 06 45 hours (e) Account for the shape of the graph for the tree with ringed stem between: (i) 06 45 hours and 15 45 hours (ii) 15 45 hours and 00 45 hours
answers
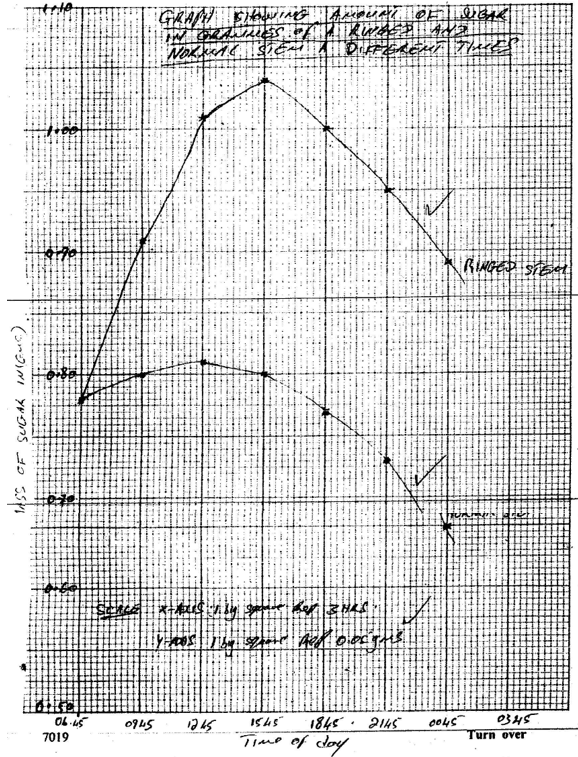
(b)(i) 15: 45
(ii) 12:45 (c) 0.79 + 0.02 grammes (d) The food that had been manufactured the previous day had been converted to soluble sugars and was being translocated to other parts of the plant. (e)0645 hours and 15 45 hours There was low concentration of sugars early in the morning as there was little translocation As day progresses the light intensity increases and more food is manufacture thus more translocation increasing concentration of sugars (ii)15 45 hours and 0045 hours The light intensity is decreasing reducing rate of photosynthesis. Less food is manufactured hence less is translocation As it turns dark there is no photosynthesis reducing concentration of sugars translocated.
0 Comments
Leave a Reply. |
Archives
December 2024
Categories
All
TOPICSFORM 1
Form 2
Form 3
Form 4
|


 RSS Feed