K.C.S.E Biology Q & A - MODEL 2011PP2QN06
An experiment was carried out to investigate the population of a certain micro-organism. Two petri-dishes were used. Into the petri-dish label led M, 60cm3 of a culture medium was placed while 30cm3 of the same culture medium was placed in petri-dish labelled N. Equal numbers of the micro-organisms were introduced in both petri-dishes. The set-ups were then incubated at 35°C. The number of micro-organisms in each petri-dish was determined at irregular intervals for a period of 60 hours. The results were as shown in the table below.
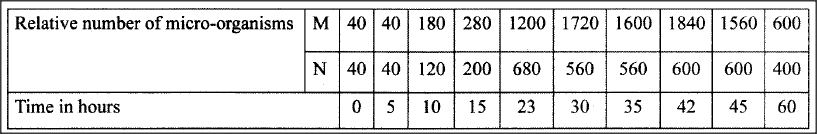
(i)On the same axes, draw the graphs of relative number of micro-organisms against time on the grid provided.
(ii) After how many hours was the difference between the two populations greatest? (iii) Work out the difference between the two populations at 50 hours. (iv) With a reason state the effect on the population of micro-organisms in petri-dish M if the temperature was raised to 60°C after 20 hours. (v) Account for the shape of the curve for population in petri-dish N between 46 hours and 59 hours.
answers
(ii) 42 hours;
(iii) Graph M at 50 hrs is 1220 ± 20. Graph N at 50 hrs is 540 ± 20 (2 m 1220-540=680±4; (iv) Population growth stops; . High temperatures kill the microorganisms/denature enzymes; (v) 46 hours to 59 hours death rate of the microorganisms is higher, than their population growth rate; due to exhaustion of nutrients; and accumulation of toxic wastes;
0 Comments
Leave a Reply. |
Archives
December 2024
Categories
All
TOPICSFORM 1
Form 2
Form 3
Form 4
|


 RSS Feed