K.C.S.E Biology Q & A - MODEL 2012PP2QN06
The data provided below represent populations of a predator and its prey over a fifty years’period.
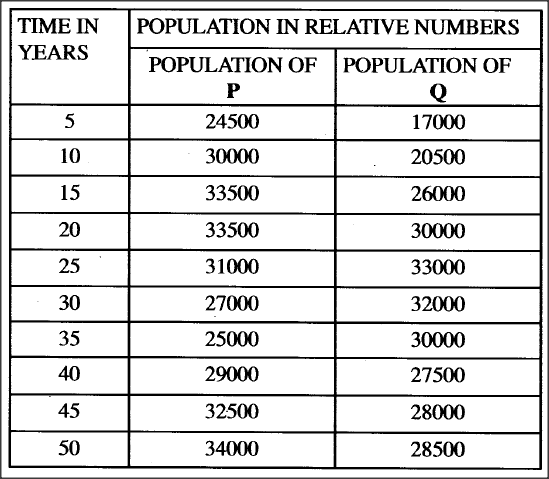
(a) (i) Using the same axes, draw graphs of the relative populations of P and Q against time.
(ii) With a reason, identify the curve that represents the prey. (iii) Account for the two populations between 25 arid 32 years. (iv) Which years were the two populations equal? (v) A part from predation, state three biotic factors that may have led to the decline of the prey population. (b) Describe the hazards of air pollution by Sulphur (IV) Oxide.
answers
(a) (i) title - Graph of Prey-predator relationship; (OWTE)
Scales X axis; Graph should cover more than half of the grid provided. Y axis; Graph should cover more than half of the grid provided. correct plotting P; Q; smooth curves P; Q; labelling axes; 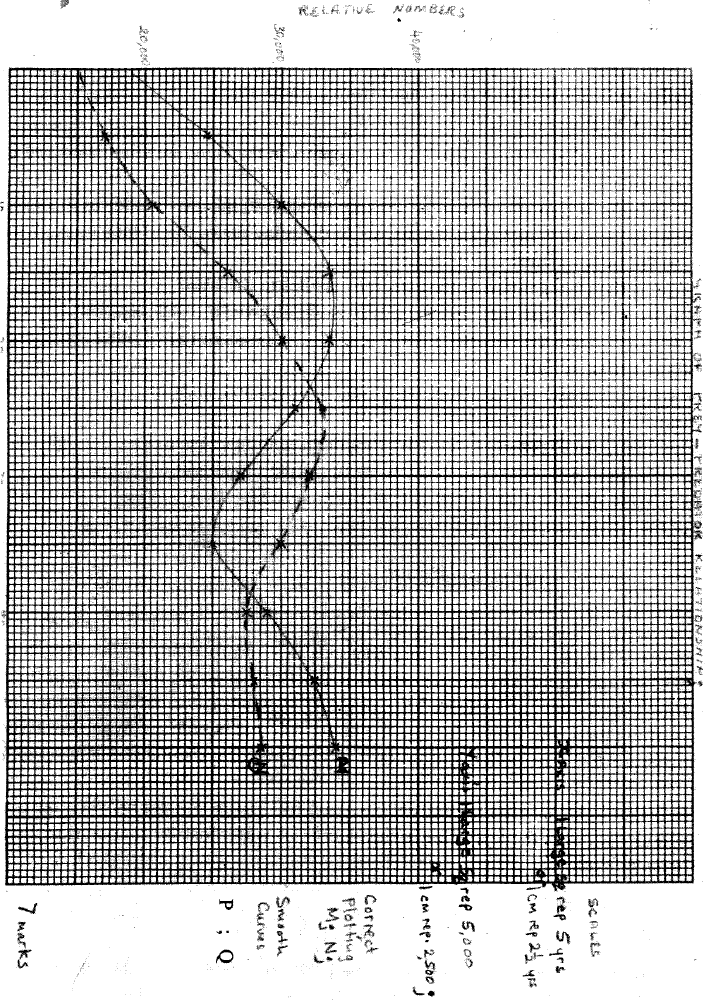
(ii) P represents the prey;
Prey population is initially higher prey population usually starts falling earlier; (iii) Both populations decrease; because prey is not enough to sustain predator/population environmental stress limit population of prey; (iv) at 23±0.5 years; and at 39±0.5; (v) less food for the prey/intra specific competition; emigration of the prey; diseases causing death of the prey; parasitism; human activities b)sulphur dioxide in the air - causes respiratory diseases; poisons plants; forms acid rain which increase soil pi-J; corrodes metals in buildings;
0 Comments
Leave a Reply. |
Archives
December 2024
Categories
All
TOPICSFORM 1
Form 2
Form 3
Form 4
|


 RSS Feed
Can't find what you are looking for? Don't worry, Use the Search Box Below.
|
Primary Resources
College Resources
|
Secondary Resources
|
Contact Us
Manyam Franchise
P.O Box 1189 - 40200 Kisii Tel: 0728 450 424 Tel: 0738 619 279 E-mail - sales@manyamfranchise.com |