K.C.S.E Biology Q & A - MODEL 2019PP2QN06
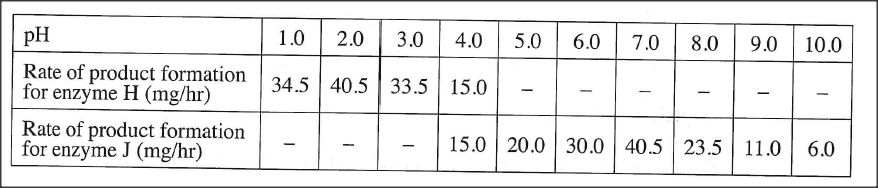
The table below shows the rate of product formation for two enzymes, H and J over a range of pH values
(a) On the same axis, plot graphs of the rate of product formation against pH.
GRAPH PAPER (b) Account for the rate of product formation for enzyme H between: (i) pH 1.0 and 3.0 (ii) pH 3.0 and 7.0. (c) From the graph, determine: . (i) the pH value at which the rate of product formation of the two enzymes was the same (ii) the value of the rate of product formation for enzymes H and J at the pH value stated in (c)(i) above (iii) the optimum pH value for enzyme J (d) State one variable that may lead to the change in the optimum rate of product-formation of the two enzymes. (e) Suggest with a reason, the likely part of the human alimentary canal where enzyme H would be found.
answers
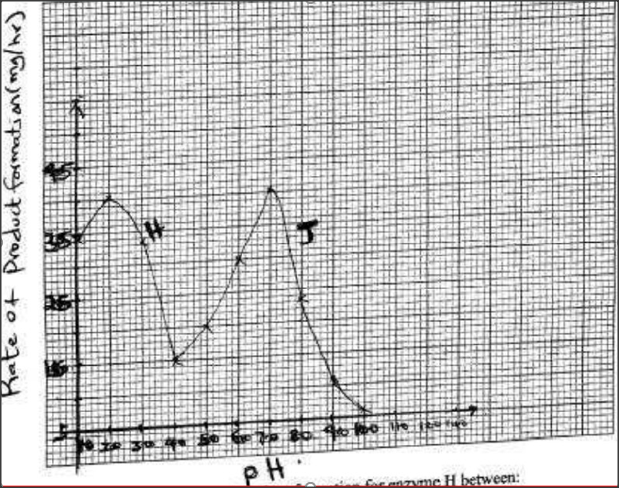
(b) (i) Rate of product formation increases with the increase in pH to the optimum then decreases;
pH 5 is the optimum pH value for activity of enzyme H; between pH 1 and 2 enzyme H/enzyme molecules are activated; Between pH 2 and 3 enzyme H (enzyme molecules) are denatured/destroyed; (. Enzyme is inactivated/ less active for denatured (ii) Rate of product formation (sharply) decreases with increase in pH; Enzyme H is (not formed by increase in pH hence is denatured); No product forms above pH 4.0 to 7.0; because all enzymes (enzyme molecules) are denatured; (c) (i) 4.0 (ii) 15.0 mg/hr (iii) 7.0 (d) -Temperature -Substrate concentration; -Enzyme concentration; -Cofactors -Co-enzymes -(Enzyme) inhibitors (e) Stomach; Acidic medium/Low pH
0 Comments
Leave a Reply. |
Archives
December 2024
Categories
All
TOPICSFORM 1
Form 2
Form 3
Form 4
|


 RSS Feed