The Inter-relationship between Living and Non-living Things
The Inter-relationship between Living and Non-living Things
In the intricate web of nature, there exists a profound inter-relationship between living and non-living things. These two components of the ecosystem are interconnected and rely on each other for survival and sustainability. Let's explore this relationship in more detail:
0 Comments
Below is a diagram of a poorly planned town showing some building and facilities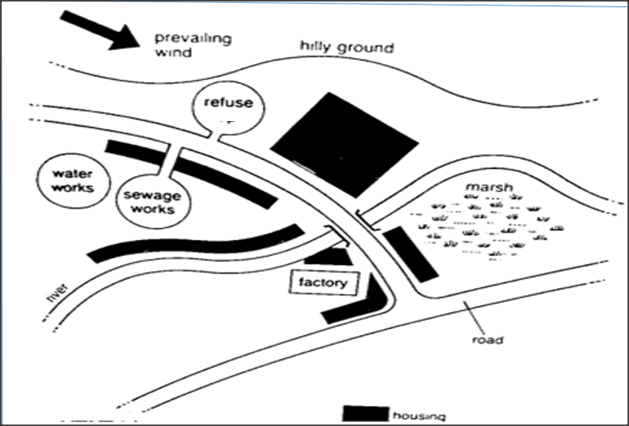 a) Giving evidence from the diagram, state two likely sources of water pollution. (2mks)
b) State three ways that the positioning of the refuse pit and sewage works pose danger to the residence of the town. (3mks)
c) Residents living close to the marsh are likely to suffer from malaria. Explain. (1mk)
d) Suggest two control measures to overcome water pollution in the area. (2mks)
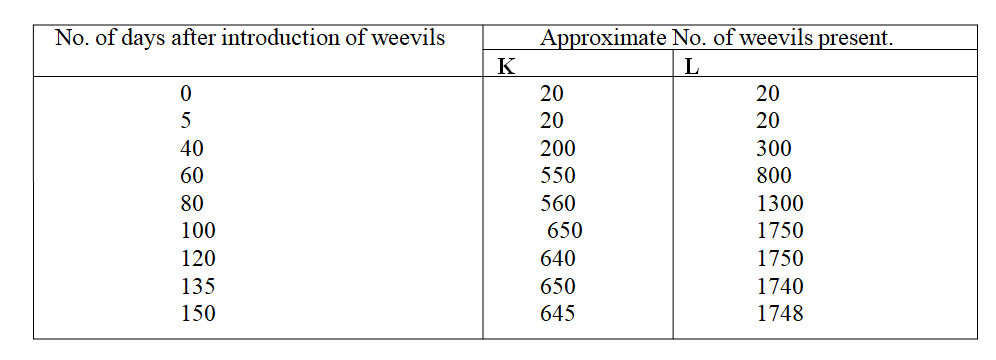
A group of students carried out a study of the population growth of flour weevils. They put 16 grams of maize flour into two equal boxes K and L respective . They then introduced equal numbers of weevils into the boxes. The boxes were kept under similar environmental conditions. The weevils were counted at intervals and the results recorded in the table below.
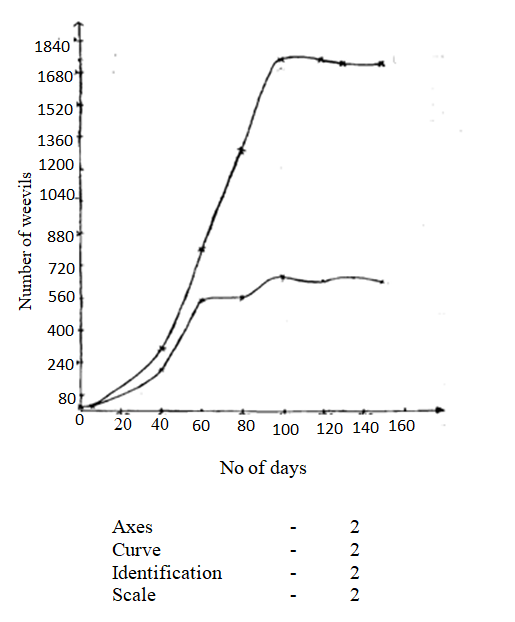
(a) Using a suitable scale ,draw two graphs on the same axes from the results in the table.
|

Cold daysContraction of erector pilli muscles; hair raised hence the dog appears larger/vasoconstriction Hot daysRelaxation of erector pilli muscles, hair lies flat hence the dog appears smaller;/ vasodilation |

|
Pesticides may kill soil micro-organisms that decompose humus to release mineral salts. In this
way they interfere with nutrient cycling.
way they interfere with nutrient cycling.

Overuse of chemical fertilizers and pesticides have effects on the soil organisms that are similar to human overuse of antibiotics. Indiscriminate use of chemicals might work for a few years, but after awhile, there aren't enough beneficial soil organisms to hold onto the nutrients” (Savonen, 1997).
1. 1989 Q4 P1
State how excessive use of pesticides may affect soil fertility
2. 1989 Q8 P1
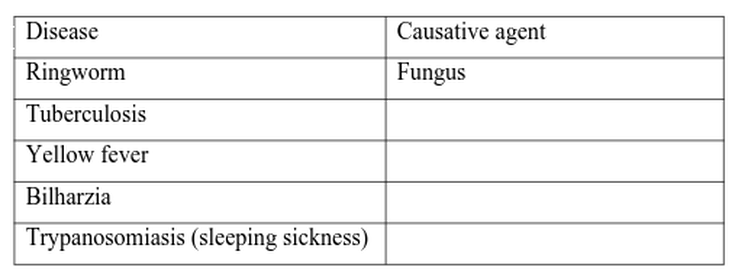
The table below shows a list of five human diseases. Complete the table by naming the causative agent of each.
The first one has been completed for you.
State how excessive use of pesticides may affect soil fertility
2. 1989 Q8 P1
The table below shows a list of five human diseases. Complete the table by naming the causative agent of each.
The first one has been completed for you.

Human Diseases
K.C.S.E Biology Q & A - MODEL 2019PP2QN07
Giving examples, describe the following interactions among organisms:
(a) predator-prey
(b) symbiosis
(c) parasitism.
(a) predator-prey
(b) symbiosis
(c) parasitism.

answers
.(a) Predator-Prey
- -Predator is an animal that hunts/kills another/ other animals(prey) for food;
- -A dog and a hare; (acc. either correct examples)
- Preys desire survival mechanism in their habitats not to be eaten/killed; to survive and reproduce/propagate this in linage; to this end (prey)(adaptations)
- -They run faster (strong hind muscles);
- -Camouflage with environments;
- -Mimic the predators; (acc. some have a wider field of view/vision;)
- -Some emits some chemical/smell that turn of predators;
- -Others like porcupine use quills/ spikes/spines to fight off predators;
- -Some have good sense of smell to detect predators; on the other hand, predators also evolve/desire means to be able to survive in such an ecosystem for instance.
- -Running faster; strong jaws/long/sharp canine/talons;
- -Camouflaging with the environment;
- -Mimicking prey
- -Sharp eyesight;
- -Strong sense of smell
- -Produce venom/poison that paralyze/kill prey.
- A close (long term) association between two organisms of different species where the two mutually benefit from each other;
- Example; The bacteria in the rumen/gut of herbivores; which help herbivores digest cellulose; as they are sheltered by the herbivores;
- -The bacteria found in the human digestive system/gut/colon
- -the bacteria are sheltered by humans;
- -The bacteria aid human in synthesis of vitamin K/ B12/enzyme microbial balance;
- -The nitrogen fixing bacteria on the root nodules of legumes;
- -NFB benefits from shelter offered by the plant;
- NFB facilitate conversion of free atmospheric Nitrogen into forms that can be readily used by the plants;
- A kind of (inter-specific) relationship/Association where one member/organism, the parasite, benefits while the other the host is harmed/loses; Also called antagonistic symbiosis)
- Example;
- A tick (parasite) sucking blood /Nutrients from a cow (host); making the cow to be anaemiac/skin destroyed/malnourished/transmission of diseases;
- Parasite can be external/Exo-Parasite; or internal/ endo-parasite; e.g. liver fluke
- Example- Liver fluke sucks blood/Nutrients from host and cause death/bodily harm on the internal Organs of the host including blocking blood vessels
K.C.S.E Biology Q & A - MODEL 2018PP1QN13
State two limitations of using a quadrat to estimate the population of organisms.
ANSWERS
- Cannot be used for most animals/plants;
- Assumes organisms are evenly distributed;
- Inaccuracy (over/under-estimation);
K.C.S.E Biology Q & A - MODEL 2017PP2QN07
Explain the importance of protecting the forest ecosystem with reference to the following:
(a) climate change
(b) biodiversity
(c) biotechnology
(d) water conservation
(e) pollution.
(a) climate change
(b) biodiversity
(c) biotechnology
(d) water conservation
(e) pollution.
answers
a) Climate change
- Promote(regular) rainfall/precipitation/prevent desertification;
- Act as wind breakers;
- Keep earth temperatures cool/reduce global warming;
- Keeps biogeochemical cycles going e.g. hydrological, carbon,nitrogen, phosphorous, sulphur cycles;
- Conserve diverse flora/ fauna;
- Conserve genetic variety;
- Prevent extinction of rare species;
- Source of research/employment;
- Aesthetic/attracting tourism in foreign exchange;
- Have impact on culture/religion/politics; ‘
- Food and shelter for other organisms and man;
- Source of oxygen;
- Manufacture of medicines/directly used as medicinal;
- Source of food/food products;
- Provide fuel (when regulated);
- Provide paper and related by-products (when regulated);
- Provide timber (when regulated);
- Products used in other industries e.g. tannin, wax, rubber, oil, honey;
- Increased ground water/high water tables;
- Adds into rivers/lakes/permanency ¡n existing water bodies/reservoirs;
- Water towers/water catchment;
- Minimize soil pollution/ensuring cover against surface run-off/wind erosion/denudation;
- Trees/vegetation clean the soil surface by absorbing nutrients from decomposed matter e.g. sewage;
- Large scale clean-up of polluted air/dust;
- Muffle noise pollution;
K.C.S.E Biology Q & A - MODEL 2016PP1QN21
The figure below illustrates a food web in a certain ecosystem.
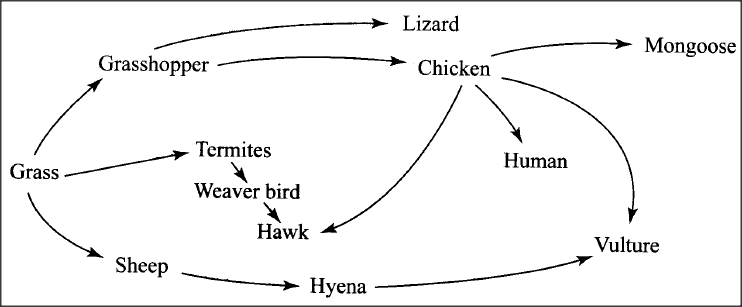
From the food web:
(a) Draw the shortest food chain
(b) Identify the organism with the highest:
(i) number of predators
(ii) biomass
(a) Draw the shortest food chain
(b) Identify the organism with the highest:
(i) number of predators
(ii) biomass
answers
K.C.S.E Biology Q & A - MODEL 2016PP1QN20
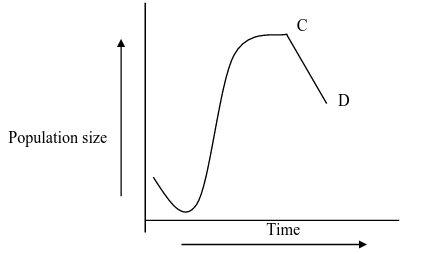
State three factors that contribute to the deceleration phase in the population curve of an organism.
answers
- Overcrowding
- Accumulation of toxic wastes
- Limited resources such as nutrients
K.C.S.E Biology Q & A - MODEL 2016PP1QN12
Other than using the quadrant, give two methods of estimating population of grass.
answers
- Belt transect
- Line transects
K.C.S.E Biology Q & A - MODEL 2016PP1QN11
Name two benefits that a parasite derives from the host
answers
- Obtains food/ nutrients
- Shelter
K.C.S.E Biology Q & A - MODEL 2015PP2QN06
The graph below shows the relative numbers of three main species of organisms in a pond.
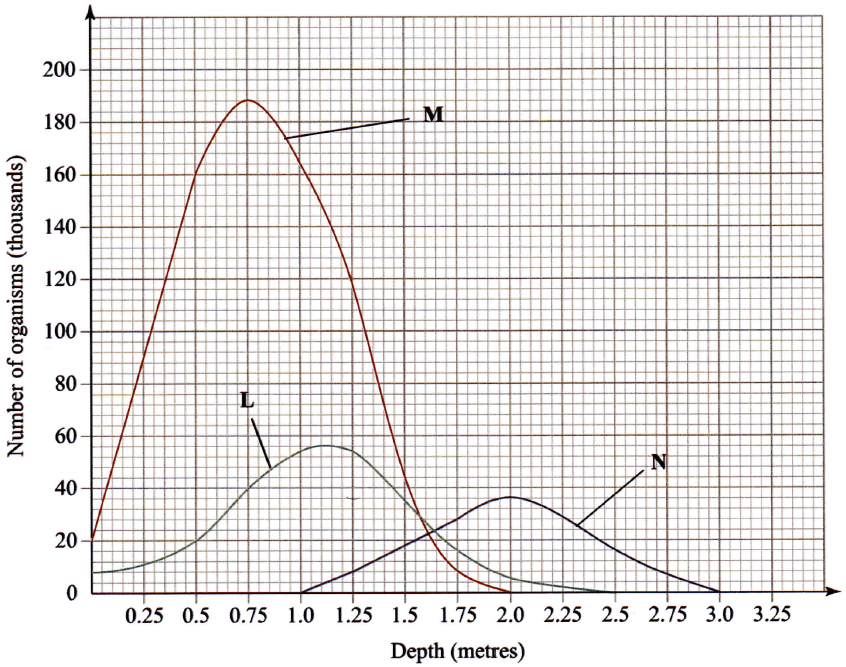
(a) Giving a reason for your answer, which of the species is a
(i) producer?
Reason
(ii) secondary consumer?
Reason
(b) State the depths at which each of the populations labelled L, M and N is at its optimum.
L
M
N
(c) (i) Which method may have been used to determine the population of organisms labelled N in the pond?
(ii) Give a reason for your answer in (c) (j) above.
(iii) State the assumptions made when using the method in (c) (i) above.
(d) State two reasons why primary productivity in the pond decreases with depth.
(e) Explain the ecological importance of fungi to plants.
(f) Why is flooding likely to lead to a cholera outbreak?
ANSWERS
(a) (i) Producer - M
Reason Largest in number hence source of food for the other species
Abundant on the water surface to trap light for photosynthesis;
(ii) Secondary consumer - N
Reason - Smaller in number than L and M
(b) L -1.125m;
M- 0.75m;
N- 2.00m;
(c) (i) Capture - Recapture (method) /Capture - mark - release - recapture;
(ii) Animals are highly mobile;
(iii) No migration during the period of survey/study;
No deaths/variation/reproductiori in population during the period;
Method of marking does not affect the animal behaviour;
Marked/released animals will freely mix with others in the pond;
Released/marked animals will have enough time to mix with the others;
There is uniform/random distribution of animals within the period.
(d) Decrease in light intensity as depth increases;
Decrease in temperature as depth increases;
(e) Breakdown of organic materials/decompose/rot/decay of materials; to release plant nutrients;
(f) Flood water may mix with human waste contaminated with cholera bacteria; The flood water may then contaminate food / water sources; The contaminated water/food causes cholera infection when ingested;
K.C.S.E Biology Q & A - MODEL 2015PP1QN12
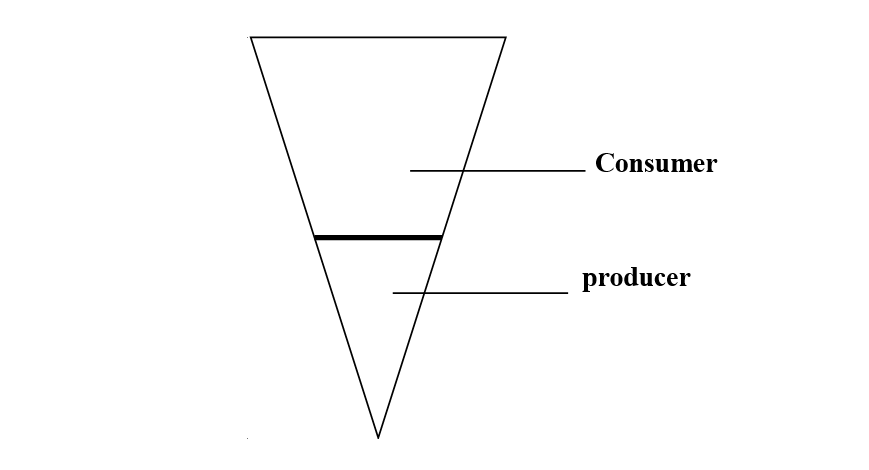
(a) What is meant by each of the following:
(i) pyramid of biomass?
(ii) pyramid of numbers’?
(b) During an ecological visit to the Savanna Grassland, students were able to see lions, antelopes, vultures and pastoralists grazing their cattle. Construct a food chain with four consumer levels to illustrate the energy flow in the ecosystem.
(i) pyramid of biomass?
(ii) pyramid of numbers’?
(b) During an ecological visit to the Savanna Grassland, students were able to see lions, antelopes, vultures and pastoralists grazing their cattle. Construct a food chain with four consumer levels to illustrate the energy flow in the ecosystem.
answers
(a) (i) Pyramid of biomas represents total dry mass weight of organisms in each trophic level;
(ii) While pyramid of numbers represents the total number of organisms at each trophic level/feeding levels/nutrition levels;
(ii) While pyramid of numbers represents the total number of organisms at each trophic level/feeding levels/nutrition levels;
K.C.S.E Biology Q & A - MODEL 2014PP2QN06
An experiment was done to determine the uptake of nitrogen from the soil by broad bean seedlings. The experiment was done with one set of seedlings M grown in the atmosphere enriched with carbon (IV) oxide and another set up of seedlings N grown in the normal atmosphere.
The amount of nitrogen in each seedling was measured in milligrams at intervals often days.
The table below shows the results obtained.
The amount of nitrogen in each seedling was measured in milligrams at intervals often days.
The table below shows the results obtained.
(a) Using the same axis draw line graphs of nitrogen uptake by the two (M and N) sets of broad bean seedlings against time.
(b) Determine the rate of uptake of nitrogen in Set M between 65 and 85 days.
(c) (i) What is the relationship between carbon (IV) oxide concentration in the air and nitrogen uptake?
(ii) Account for the relationship in (c)(i) above.
(d) (i) What would happen to the concentration of nitrogen in the seedlings in set M, if after 75 days the seedlings are transferred to a normal atmosphere.
(ii) Explain your answer in (d)(i) above.
(e) State three ways in which nitrogen fixation occurs.
answers
(c) (i) The higher the carbon UV) oxide content in air, the higher the nitrogen uptake and vice versa;
(ii) More Carbon (IV) oxide in the air makes the seedlings to photosynthesize more; hence more amino acids/protein; are formed in the dark stage; formation of amino acids/protein requires nitrogen;
(d) (i) The concentration of nitrogen would remain constant;
(ii) Despite decline in CO,; the nitrogen already absorbed/taken up by the plant will still remain:
(iii) Lightning;
By free-living bacteria/micro organisms;
By Rhizobium (in root nodules of legumes);
K.C.S.E Biology Q & A - MODEL 2013PP2QN06
A scientist carried out an investigation to find out the population growth of mice under laboratory conditions. Twenty young mice were placed in a cage. The results obtained from the investigation were as shown in the table below.

(a) On the grid provided, draw a graph of the number of mice against time.
GRAPH PAPER
(b) Account for the changes in mice population between
(i) O to 2 months
(ii) 2 to 6 months
(iii) 6 to 10 months
(iv) 10 to 12 months.
(c) (i) Between which two months was the population change greatest?
(ii) Calculate the rate of population change over the period in (c)(i) above.
(d) What change in population would be expected if the investigation was continued to the 19th month?
(e) To obtain the observed results state two variables that were kept constant during the investigation.
answers
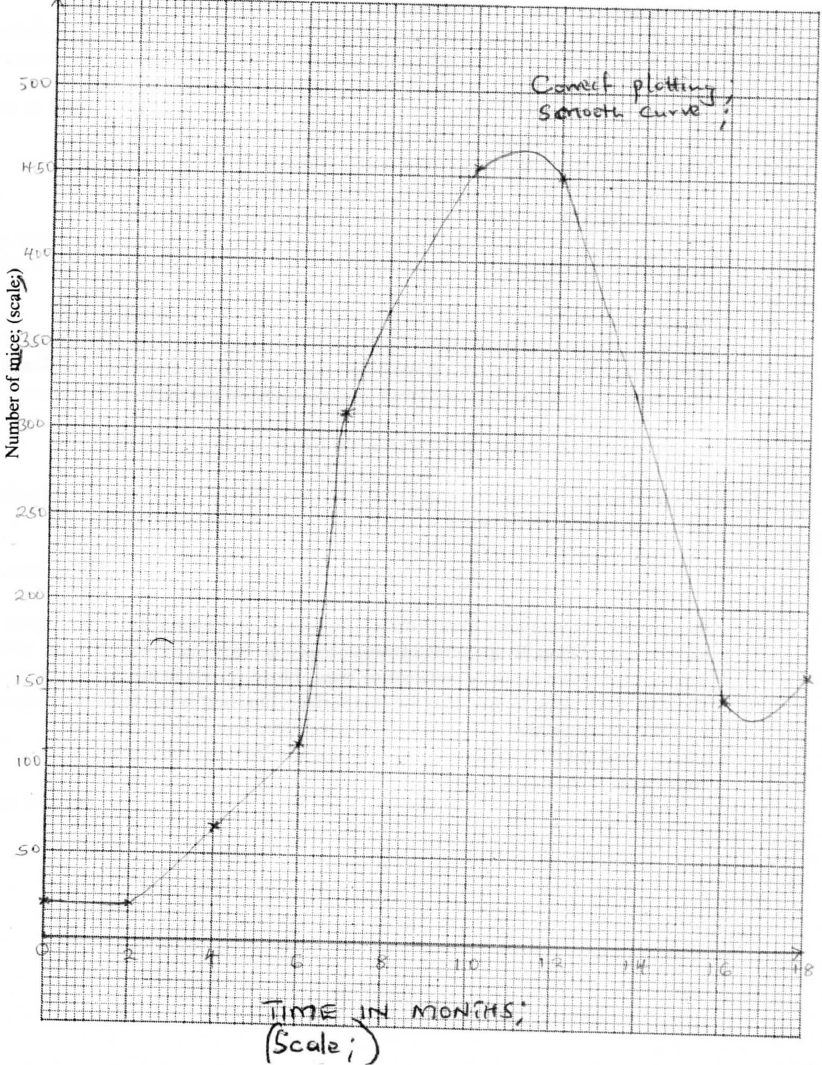
(b) (i) No change in population/population is constant: mice still maturing/have not given birth:
(ii) Slow/gradual population growth; few mice have reached sexual maturity;
(iii) Faster/rapid rate of population growth/exponential;
Many mice sexually matured/reproducing/enough food/space/no competition birth rate higher than death/no diseases:
(iv) Population decline;
Competition is high / food is limiting / space is limiting/accumulation of toxic waste/disease (outbreak) deathrate higher than birth rate.
(c) (i) 6 and 8;
(ii) 310-115 = 195 mice per month;
(d) Population would increase;
(e) Food; space ; cage size; water;
Describe how environmental factors increase the rate of transpiration in terrestrial plants.
26/6/2020
K.C.S.E Biology Q & A - MODEL 2012PP2QN08
Describe how environmental factors increase the rate of transpiration in terrestrial plants.
ANSWERS
In bright light; stomata are fully/wide open; increasing contact between the atmosphere and air spaces in the leaf; This in turn increases water loss by evaporation through the
open stomata
High environmental temperatures; increase the rate of evaporation from the leaf surface
thus more water leaves cells due to the increased diffusion gradient;
Iii a windy day; air around the leaf is carried away reducing water vapour around the
leaf; more water moves into the atmosphere from the leaf air spaces;
In low humidity/when the atmosphere is less saturated with water vapour; more
water will move from leaf air spaces into the atmosphere; leading to increased rate of
transpiration; .
Low atmosphere pressure; increases diffusion gradient between atmospheric and leaf
increased rate of evaporation;Availability of water; causes turgidity of guard cells hence stomata open; increasing
rate of transpiration.
K.C.S.E Biology Q & A - MODEL 2012PP2QN06
The data provided below represent populations of a predator and its prey over a fifty years’period.
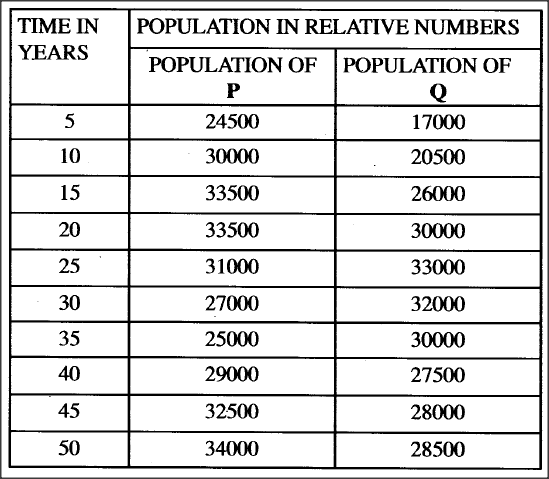
(a) (i) Using the same axes, draw graphs of the relative populations of P and Q against time.
(ii) With a reason, identify the curve that represents the prey.
(iii) Account for the two populations between 25 arid 32 years.
(iv) Which years were the two populations equal?
(v) A part from predation, state three biotic factors that may have led to the decline of the prey population.
(b) Describe the hazards of air pollution by Sulphur (IV) Oxide.
answers
(a) (i) title - Graph of Prey-predator relationship; (OWTE)
Scales X axis; Graph should cover more than half of the grid provided.
Y axis; Graph should cover more than half of the grid provided.
correct plotting P; Q;
smooth curves P; Q;
labelling axes;
Scales X axis; Graph should cover more than half of the grid provided.
Y axis; Graph should cover more than half of the grid provided.
correct plotting P; Q;
smooth curves P; Q;
labelling axes;
(ii) P represents the prey;
Prey population is initially higher prey population usually starts falling earlier;
(iii) Both populations decrease;
because prey is not enough to sustain predator/population environmental stress limit
population of prey;
(iv) at 23±0.5 years; and at 39±0.5;
(v) less food for the prey/intra specific competition;
emigration of the prey;
diseases causing death of the prey;
parasitism;
human activities
b)sulphur dioxide in the air - causes respiratory diseases; poisons plants; forms
acid rain which increase soil pi-J; corrodes metals in buildings;
K.C.S.E Biology Q & A - MODEL 2012PP1QN21
Name the process through which free atmospheric nitrogen is converted into nitrates.
answer
- Nitrogen fixation;
Archives
December 2024
January 2024
November 2023
January 2023
December 2022
September 2022
August 2022
April 2022
March 2022
November 2021
October 2021
September 2021
November 2020
October 2020
August 2020
July 2020
June 2020
May 2020
April 2020
September 2019
August 2019
October 2015
Categories
All
1995
1996
1997
1998
1999
2000
2001
2002
2003
2004
2005
2006
2007
2008
2009
2010
2011
2012
2013
2014
2015
2016
2017
2018
2019
Animals
Bilharzia
BIOLOGY ESSAY
Blood Cells
Cell Physiology
CHARACTERISTICS OF LIVING THINGS
Chromosomes
Circulatory System
Classification
Co-ordination
DASHBOARD
Diffusion
Diseases
DNA
Ecology
Evolution
Excretion And Homeostasis
Form 1
Form 2
Form 3
Form 3 Level
Form 4
FUNGI
Gaseous Exchange
Genetics
GERMINATION
Growth And Development
HIV/AIDS
HORMONES
Introduction To Biology
Kidney
Malaria
METABOLISM
Nutrition
Nutrition In Animals
Nutrition In Plants
Osmosis
Oxygen
Paper 1
Paper 2
PAPER 3
Photosynthesis
PHOTOTROPISM
PLANT CELLS
POLLINATION
Reception
Reception_Response And Coordination In Plants And Animals
Reproduction In Animals
Reproduction In Plants And Animals
Respiration
Response And Co Ordination
REVISION KIT
Section A
SECTION B
Section C
Sodium
Support And Movement In Plants And Animals
TAXONOMY
TERM 1
TERM 2
The Cell
Theory Of Inheritance Of Acquired Characteristics
Transplant In Plants
Transport In Plants And Animals
TOPICS
FORM 1
Form 2
Form 3
Form 4


 RSS Feed
Can't find what you are looking for? Don't worry, Use the Search Box Below.
|
Primary Resources
College Resources
|
Secondary Resources
|
Contact Us
Manyam Franchise
P.O Box 1189 - 40200 Kisii Tel: 0728 450 424 Tel: 0738 619 279 E-mail - sales@manyamfranchise.com |