K.C.S.E Biology Q & A - MODEL 2012PP1QN05
The table below shows results of a study of three plants C, D and E growing in different habitats.
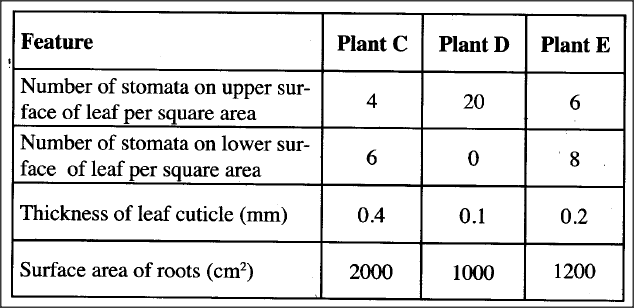
(a) Which one of the plants C, D and E grows in an area of relatively low water availability?
(b) Explain your answer in (i) above.
answers
(a) Plant C;
(b) Thick cuticle reduces water loss; Low number of stomata reduces water loss; Large root-surface area enhances water absorption;
0 Comments
K.C.S.E Biology Q & A - MODEL 2011PP2QN06
An experiment was carried out to investigate the population of a certain micro-organism. Two petri-dishes were used. Into the petri-dish label led M, 60cm3 of a culture medium was placed while 30cm3 of the same culture medium was placed in petri-dish labelled N. Equal numbers of the micro-organisms were introduced in both petri-dishes. The set-ups were then incubated at 35°C. The number of micro-organisms in each petri-dish was determined at irregular intervals for a period of 60 hours. The results were as shown in the table below.
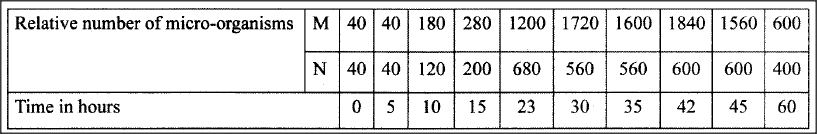
(i)On the same axes, draw the graphs of relative number of micro-organisms against time on the grid provided.
(ii) After how many hours was the difference between the two populations greatest? (iii) Work out the difference between the two populations at 50 hours. (iv) With a reason state the effect on the population of micro-organisms in petri-dish M if the temperature was raised to 60°C after 20 hours. (v) Account for the shape of the curve for population in petri-dish N between 46 hours and 59 hours.
answers
(ii) 42 hours;
(iii) Graph M at 50 hrs is 1220 ± 20. Graph N at 50 hrs is 540 ± 20 (2 m 1220-540=680±4; (iv) Population growth stops; . High temperatures kill the microorganisms/denature enzymes; (v) 46 hours to 59 hours death rate of the microorganisms is higher, than their population growth rate; due to exhaustion of nutrients; and accumulation of toxic wastes; K.C.S.E Biology Q & A - MODEL 2011PP1QN14
The diagram below represents a certain plant.

(a) What is the likely habitat for the plant?
(b) Give two reasons for your answer in (a) above.
answers
(a) Dry/Arid/Semi-arid/Desert;
(b) Succulent/ fleshy stem; reduced leaves/leaves reduced into thorns/leaves modified into spines/spikes; K.C.S.E Biology Q & A - MODEL 2011PP1QN06
What is meant by the following terms?
(a) Ecology. (b) Carrying capacity. 
answers
(a) This is the study of the inter-relationship between organisms and their environment;
(b) The maximum population of a species than a particular habitat can support; without depletion of resources. K.C.S.E Biology Q & A - MODEL 2011PP1QN05
The figure below illustrates a food web in a certain ecosystem.

From the food web:
(a) draw the shortest food chain; (b) identify the organisms with the highest (i) number of predators; (ii) biomass.
answers
(a) Grass > Grasshopper >- Lizards;
(b) (i) Chicken; (ii) Grass; K.C.S.E Biology Q & A - MODEL 2010PP2QN03
The diagram below represents a food web in a certain ecosystem.

(a) Name the trophic level occupied by each of the following:
(î) caterpillars; (ii) small insects. (b) From the food web, construct two food chains which end with lizards as a tertiary consumer. (e) (i) Which organisms have the least biomass in this ecosystem? (ii) Explain the answer in (c) (1) above.
ANSWERS
(a) (i) Primary consumers;
(ii) Primary/secondary consumers; (b) Green plants — Caterpillars — Lizards; Decaying leaves —Caterpillars — small insects — Lizards; (e) (i) Hawks; (ii) At each trophic level energy is lost as heat in respiration; and during decomposition; lost in defecation/faeces/ waste products or metabolism/excretion; some parts of organism not eaten e.g. feathers;
K.C.S.E Biology Q & A - MODEL 2010PP1QN25
State three factors that contribute to the deceleration phase in the population curve of an organism.
answers
K.C.S.E Biology Q & A - MODEL 2010PP1QN13
What is meant by the following terms?
(a) Habitat; (b) Ecosystem.
answers
(a) Place or environment in which specified organisms live;
(b) A natural unit with abiotic and biotic factors;
K.C.S.E Biology Q & A - MODEL 2009PP2QN03
Name a substance that is responsible for acid rain
answers
K.C.S.E Biology Q & A - MODEL 2009PP2QN03
What are the effects of eutrophication
answers
( Proliferation of plants) block light from reaching plants underneath which will not photosynthesize the plants die and decompose leading to lack/ depletion of O2; animals also die/ suffocate.
K.C.S.E Biology Q & A - MODEL 2009PP2QN03
What is eutrophication?
answer
K.C.S.E Biology Q & A - MODEL 2009PP1QN20
Other than using the quadratic, give two methods of estimating population of grass
answers
Name one process that is responsible for loss of energy from one trophic level to the next23/6/2020
K.C.S.E Biology Q & A - MODEL 2009PP1QN19
Name one process that is responsible for loss of energy from one trophic level to the next
answers
K.C.S.E Biology Q & A - MODEL 2009PP1QN19
State three effects of dumping untreated sewage into a river
answers
K.C.S.E Biology Q & A - MODEL 2009PP1QN02
Name two befits that a parasite derives from the host
ANSWERS
K.C.S.E Biology Q & A - MODEL 2008PP2QN07
Describe the nitrogen cycle
answers
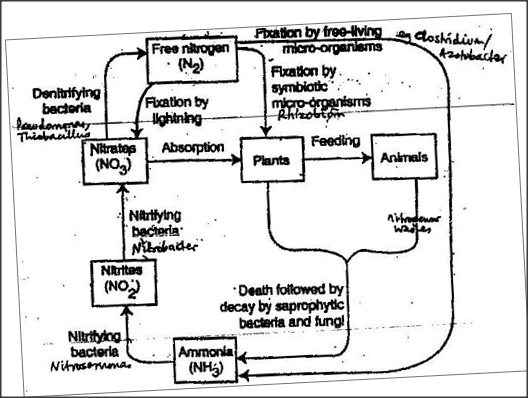
During thunderstorm/ lightning; nitrogen gas combines with O2 to form nitrogen oxides; nitrogen oxides dissolve in water to for nitric acid; acid is deposited in the soil by rain, nitric acid combines with chemical substance to form nitrates/ nitric acids dissolves to form nitrates which are absorbed by plants symbiotic bacteria/ such as rhizobium; which are found in root nodules of leguminous plants, fix free nitrogen to nitrates.
Free living bacteria/ clatridium/ azotobacteria fix nitrogen to all rates Nostoc algae/ chlorella/ anaemia/ ix nitrogen to nitrates. Plants use Nitrates to form plant proteins Animals feed on plants and convert plant proteins into animal proteins Plants/ animals die and decomposed by bacteria/ saprophytes/ fungi decomposing plants/ animals/ release ammonia which is covered to nitrates/ by nitrosomomes nitrococcus bacteria Nitrates are converted to nitrates; by nitrobacteria Nitrates in the soil can be converted to free nitrogen/ denitrification by some fungi; pseudomonas/ hulobacillus denitrifying bacteria.
K.C.S.E Biology Q & A - MODEL 2008PP1QN14
Describe the three characteristics of a population
ANSWERS
K.C.S.E Biology Q & A - MODEL 2007PP2QN08
Describe causes and methods of controlling water pollution
answers
K.C.S.E Biology Q & A - MODEL 2007PP1QN15
Name a method that could be used to estimate the population size of the following organisms
(i) Fish in a pond (ii) Black jack in a garden
ANSWERS
(i) Capture and recapture method
(ii) Line transect
K.C.S.E Biology Q & A - MODEL 2007PP1QN15
Distinguish between population and community
ANSWERS
Give three reasons for loss of energy from one trophic level to another in the food chain.19/6/2020
K.C.S.E Biology Q & A - MODEL 2006PP2QN03
Give three reasons for loss of energy from one trophic level to another in the food chain.
answers
K.C.S.E Biology Q & A - MODEL 2006PP2QN03
Distinguish between pyramid of numbers and pyramid of biomass.
answers
K.C.S.E Biology Q & A - MODEL 2006PP1QN26
The chart below represents a simplified nitrogen cycle.
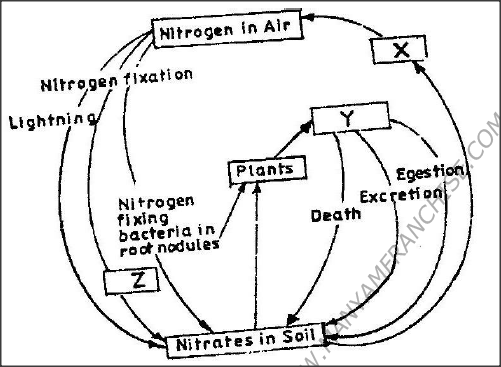
What is represented by X,Y, and Z?
answers
X- Denitrifying bacteria/ denitrification
Y- Animals/ Herbivores; accept primary consumers Z- Nitrogen fixing bacteria ( in soil) accept Azotobacter. A dog weighing 15.2kg requires 216kj while a mouse weighing 50g requires 2736kj per day. Explain.19/6/2020
K.C.S.E Biology Q & A - MODEL 2006PP1QN25
A dog weighing 15.2kg requires 216kj while a mouse weighing 50g requires 2736kj per day. Explain.
answer
K.C.S.E Biology Q & A - MODEL 2006PP1QN16
What is the importance of the following in an ecosystem?
a) Decomposers b) Predation
answers
(a) Decomposer – recycling of nutrients
(b) Predation – regulation of numbers/ population |
Archives
December 2024
Categories
All
TOPICSFORM 1
Form 2
Form 3
Form 4
|


 RSS Feed
Can't find what you are looking for? Don't worry, Use the Search Box Below.
|
Primary Resources
College Resources
|
Secondary Resources
|
Contact Us
Manyam Franchise
P.O Box 1189 - 40200 Kisii Tel: 0728 450 424 Tel: 0738 619 279 E-mail - sales@manyamfranchise.com |