Zawadi operates a hardware business in her home town. Outline four methods she can use to determine prices for her goods other than the forces of demand and supply.
0 Comments
Circumstances when a manufacturer may prefer selling directly to consumers.
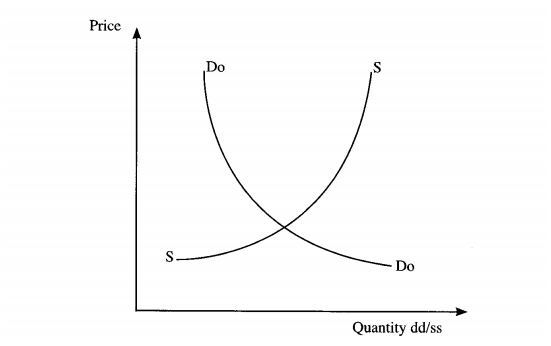
Effects of excess demand and excess supply on market pricesWhere;
Dd – Demand curve
Ss – Supply curve. Qpe – Equilibrium price. P2 – Price below equilibrium P1 – Price above equilibrium.

Factors influencing decisions on what goods and services to produce.

With the aid of a diagram, explain the effect of an increase in the supply of a commodity while its demand remains constant.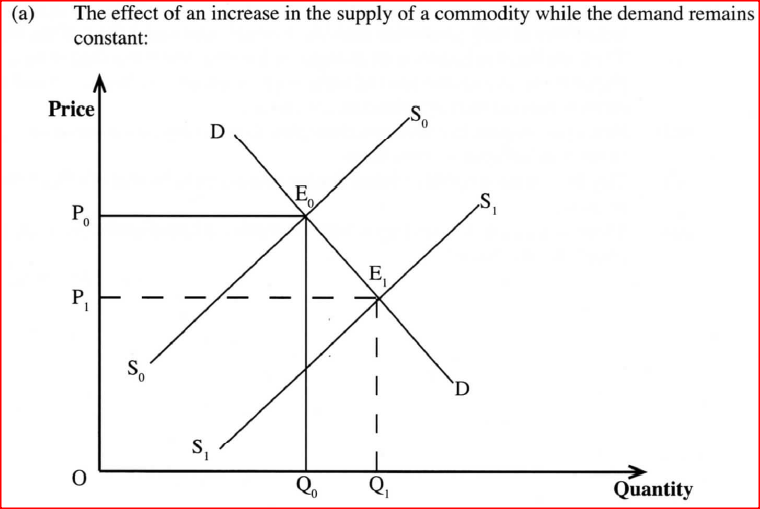
Highlight four factors that may cause the supply curve to shift to the right.
Factors that may cause the supply curve to shift to the right include:
The table below shows the demand and supply schedules for product A in a week.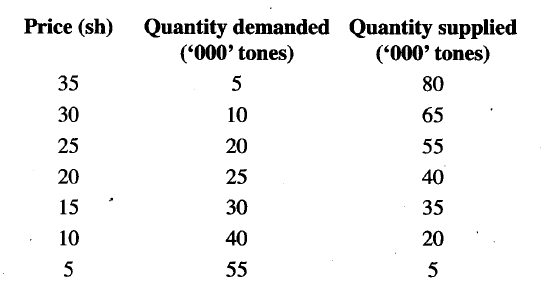
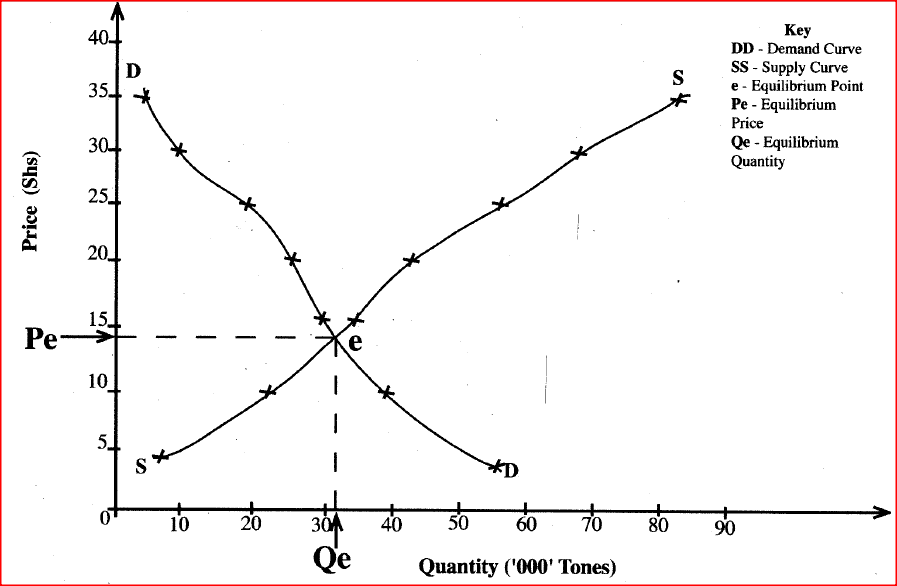
Using the information given in the table above, draw the demand and supply curves showing the market equilibrium for the product. (10 marks)
The demand and supply curves for product X showing its market equilibrium.
Zawadi operates a hardware business in her home town. Outline four methods she may use to determine prices for her goods other than the forces of demand and supply.
Methods of determining prices other than the forces of demand and supply include:
There has been a decline in the demand for wooden furniture. Explain five factors that may have caused this trend
Factors that may have caused a decline in the demand for wooden furniture include:

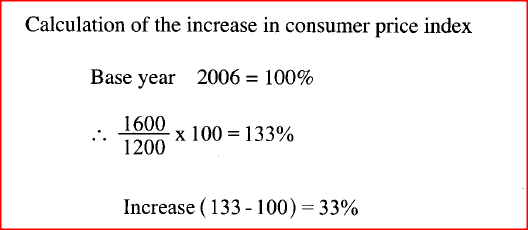
The cost of consumer goods and services for a representative basket of an average family is given below.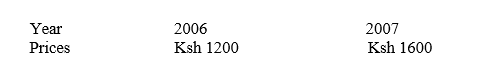
Determine the increase in Consumer Price Index using 2006 as the base year.
The table given below represents the supply schedule of sukuma wiki (kales) for eight weeks in the months of January and February 2009.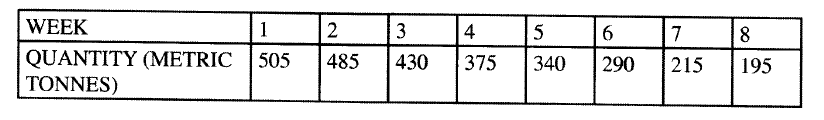
Outline four causes of the trend in the table. (4 marks)
Causes of the declining supply of sukuma wiki include:
Explain five negative effects that inflation may have on the economy of a country.

The diagram below represents the relationship between population and income per capita.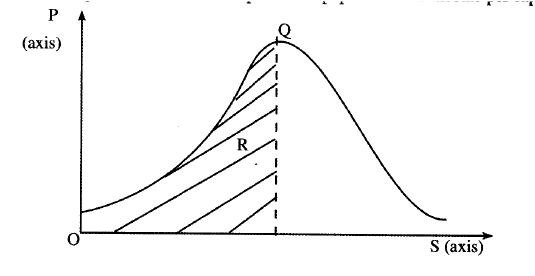
State what is represented by P and S axes, and letters R and Q.
(i) P(axis) . (ii) S (axis) . (iii) R (iv) Q
The letters represent. ‘
The figure below shows a shift in the supply curve of a given commodity.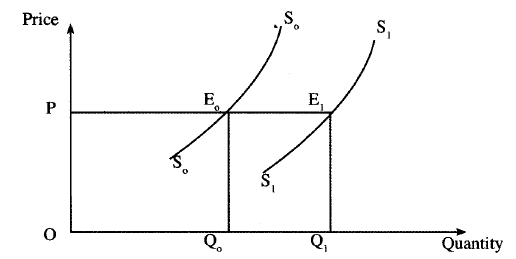
Outline four factors that may have caused the shift in the supply curve from S0 to S1.
Factors that may have caused the shift in supply include:
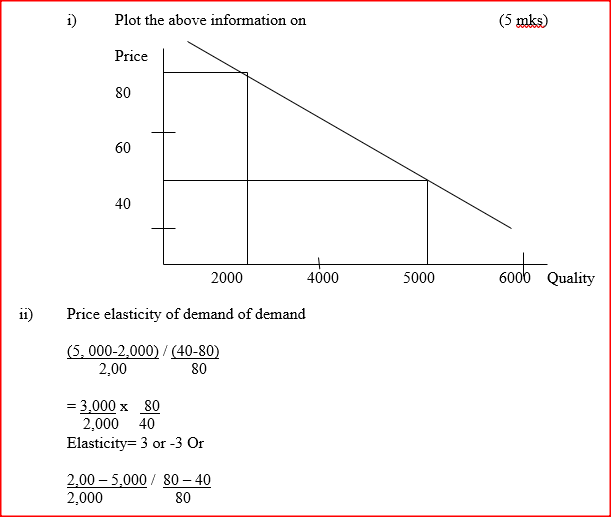
The following table represents the price and quantity of a commodity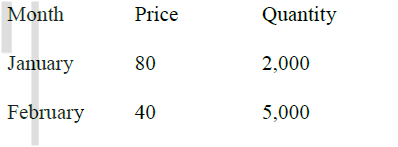
The diagram below shows an oligopolist kinked demand curve DD and current price and quantity at P and Q respectively.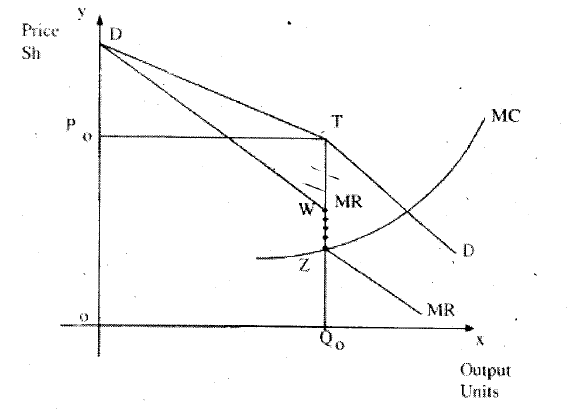
(i) Name the curve represented by the gap WZ
(ii) State Why the curve WZ is vertical to price axis (iii) Advice when the oligopolist can raise and lower the price of the commodity
Expected Responses
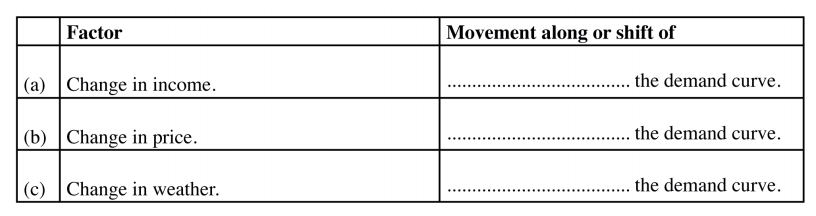
In the spaces provided below. indicate whether the following factors cause movement along the demand curve or a shift of the demand curve. (3 marks)
Expected Response
Indicating whether factors cause movement along the demand curve or a shift of the demand curve:
Write the type of demand represented by each of the following statements
Write the type of demand represented by each of the following statements
(i) Demand for a commodity causes an increase in demand for another Commodity (ii) Demand for one commodity calls for demand of another commodity The type of demand represented by statements are:

With the aid of a diagram, explain the behaviour of average cost curve in the short run for a firm with fixed production capacity.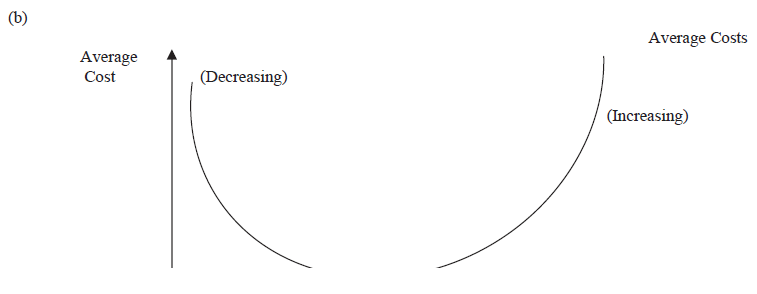
The figure below shows a decrease in demand for a commodity from DD to D1D1.State four possible causes that have led to this situation.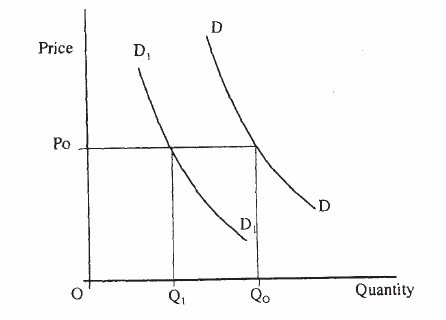
State four possible causes that have led to this situation.
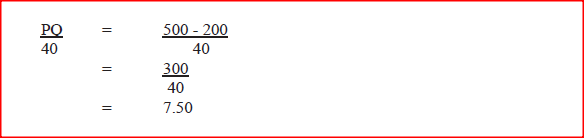
The diagram below shows total cost curve of a firm in the short-run.Calculate the average variable cost of the firm.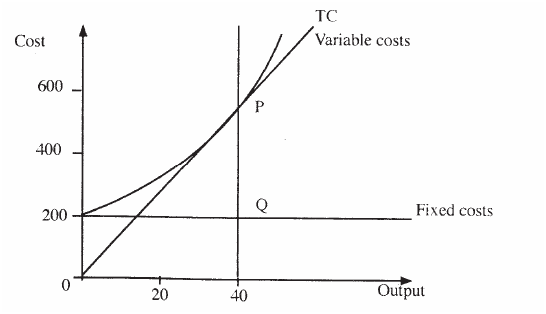
.Calculate the average variable cost of the firm.
Explain five factors that could affect the quantities of cabbages supplied in a market. (10mks)12/12/2020 Explain five factors that could affect the quantities of cabbages supplied in a market.
Factors that could affect the quantities of cabbages supplied in a market.

The diagram below shows the current demand for petrol. What is the effect of a fall in the price of cars on demand for petrol? Draw a new demand curve on the diagram above to show the effect of a fall in price or cars.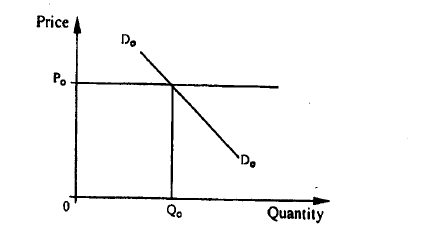
What is the effect of a fall in the price of cars on demand for petrol?
Draw a new demand curve on the diagram above to show the effect of a fall in price or cars. 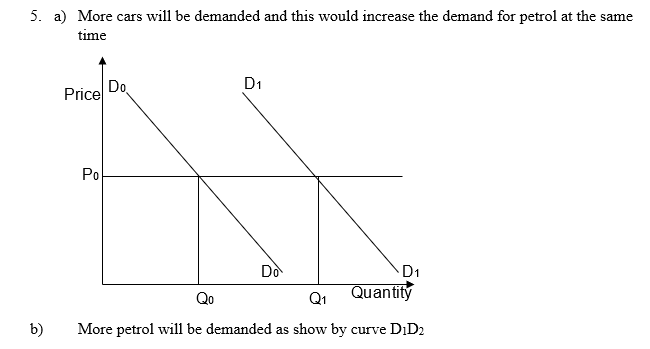
The graph given below represents the demand and supply curves of milk:
State four effects of a shift of the demand curve to the right. (4 marks)
|

Categories
All
Archives
December 2024
|
 RSS Feed