KCSE MATHEMATICS QUESTIONS AND SOLUTIONS ~ Topically Analyzed
Comprehensive Answers and Marking Schemes KNEC Certified
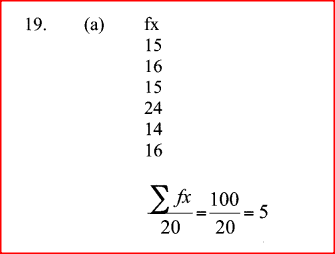
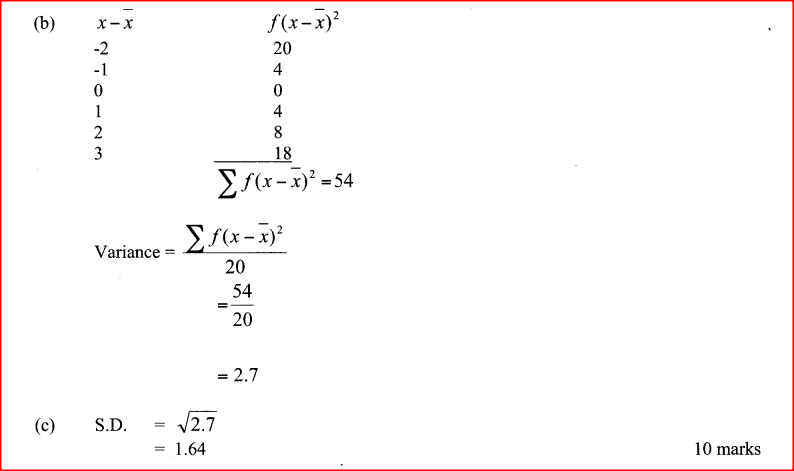
ALT B | STATISTICS II | | FORM 4 LEVEL | SECTION II | PAPER 2 | KCSE 2010 | QUESTION 19The table below represents the number of streams in 20 schools. Calculate: (a) the mean number of streams per school; (3 marks) (b) the variance; (5 marks) (c) the standard deviation correct to 2 decimal places. (2 marks) 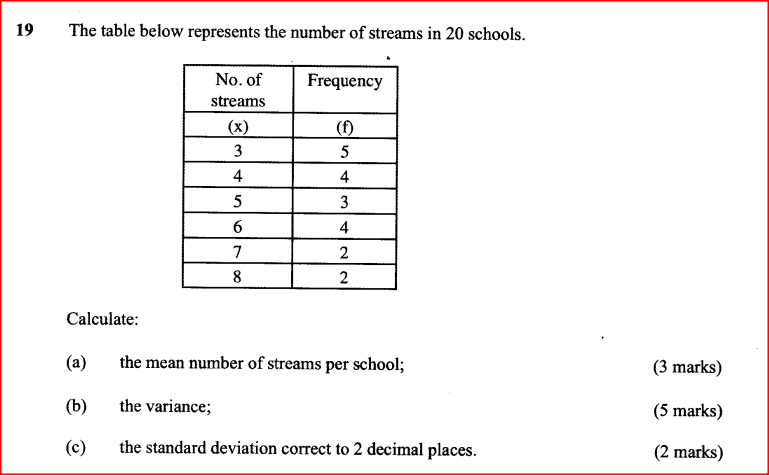 ANSWERS
0 Comments
statistics ii | kcse 1996 | question 19 | paper 2 | section bIn an agricultural research centre, the length of a sample of 50 maize cobs was measured and recorded. The recorded measurements are presented in the frequency distribution table below.  Calculate
MARKING SCHEME

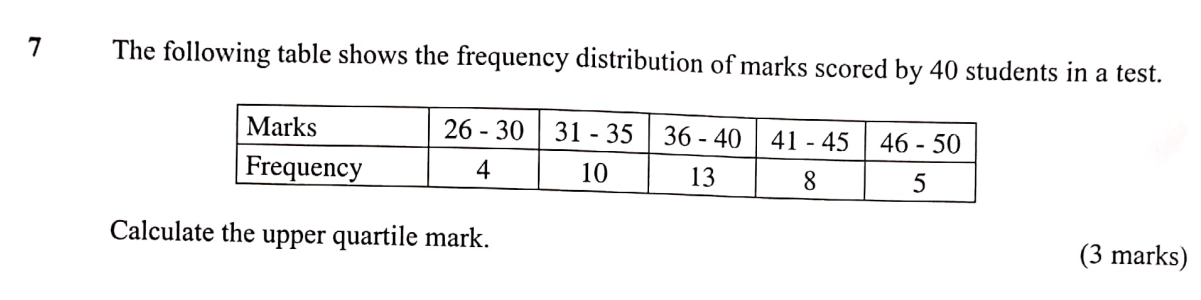
The following table shows the frequency distribution of marks scored by 40 students in a test1/1/2024 QUESTION 7 | KCSE 2023 | STATISTICS II | PAPER 2 | FORM 4 LEVELThe following table shows the frequency distribution of marks scored by 40 students in a test. Calculate the upper quartile mark. (3 marks) 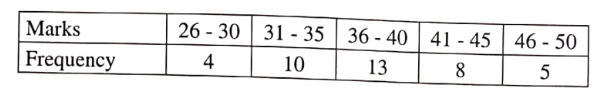 QUESTION:
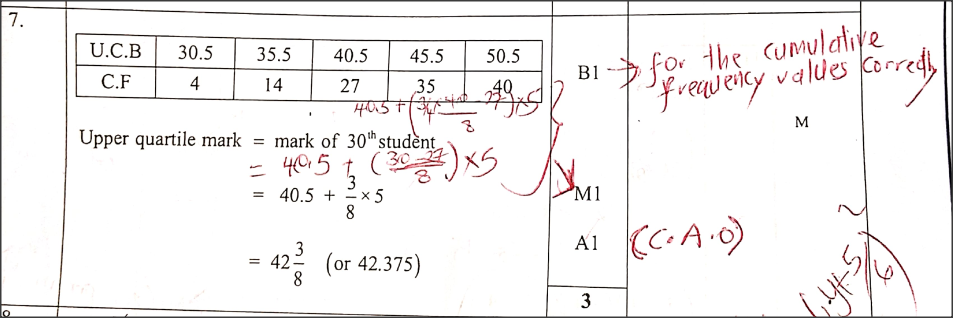
MARKING SCHEME:
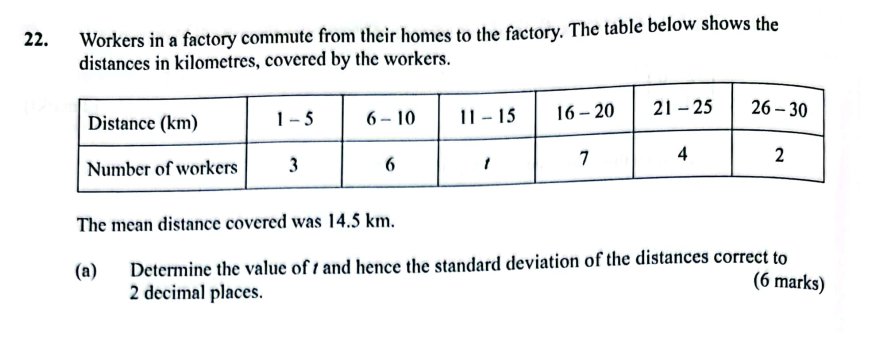
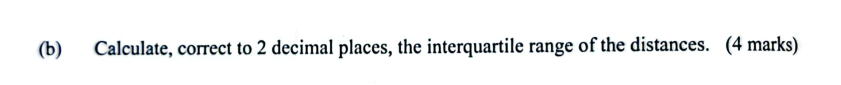
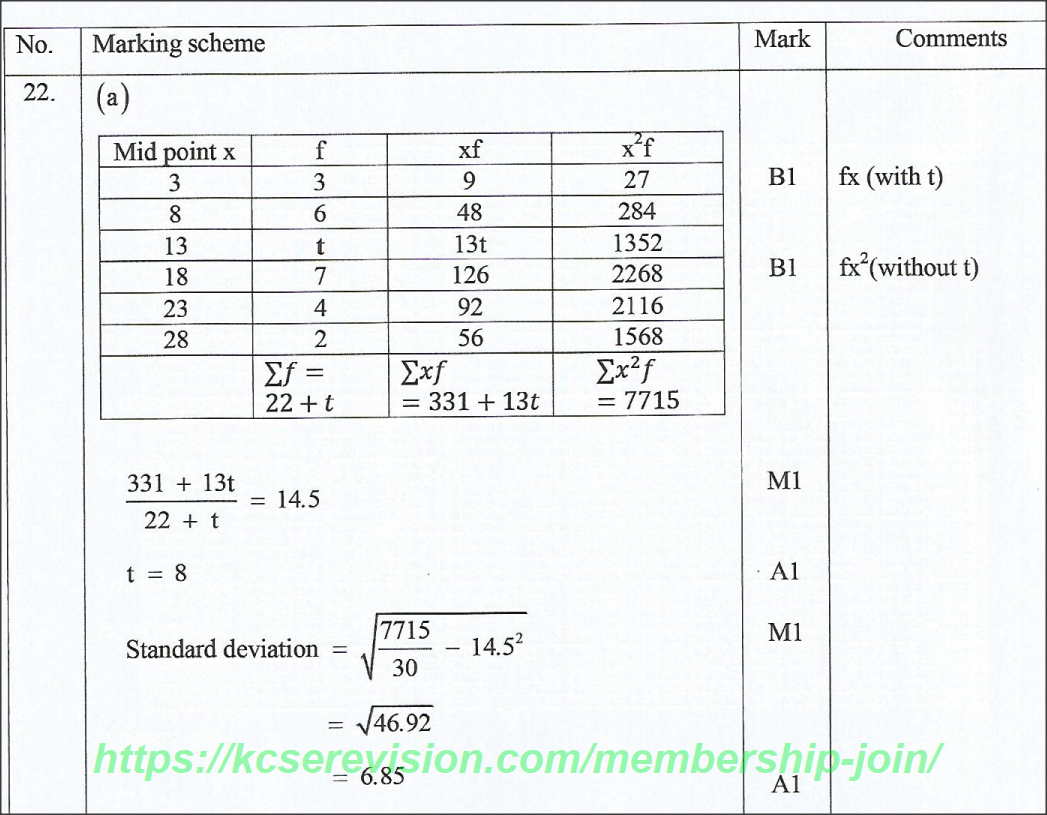
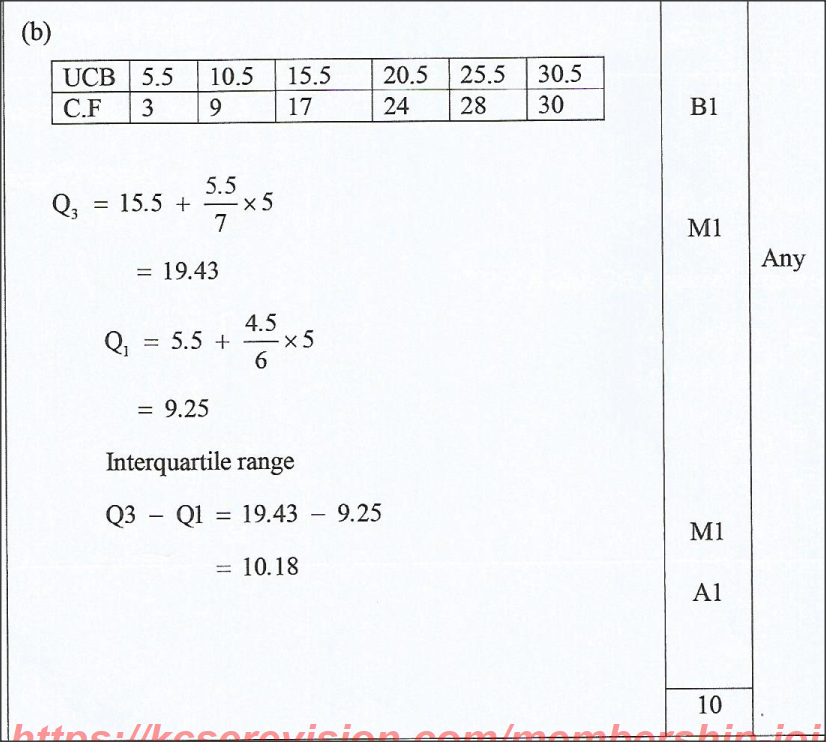
QUESTION 22 | KCSE 2021 | STATISTICS II | PAPER 2 | FORM 4 LEVELWorkers in a factory commute from their homes to the factory. The table below shows the distances in kilometres, covered by the workers. 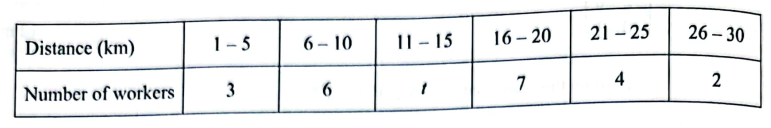 The mean distance covered was 14.5 km.
QUESTION:
MARKING SCHEME:
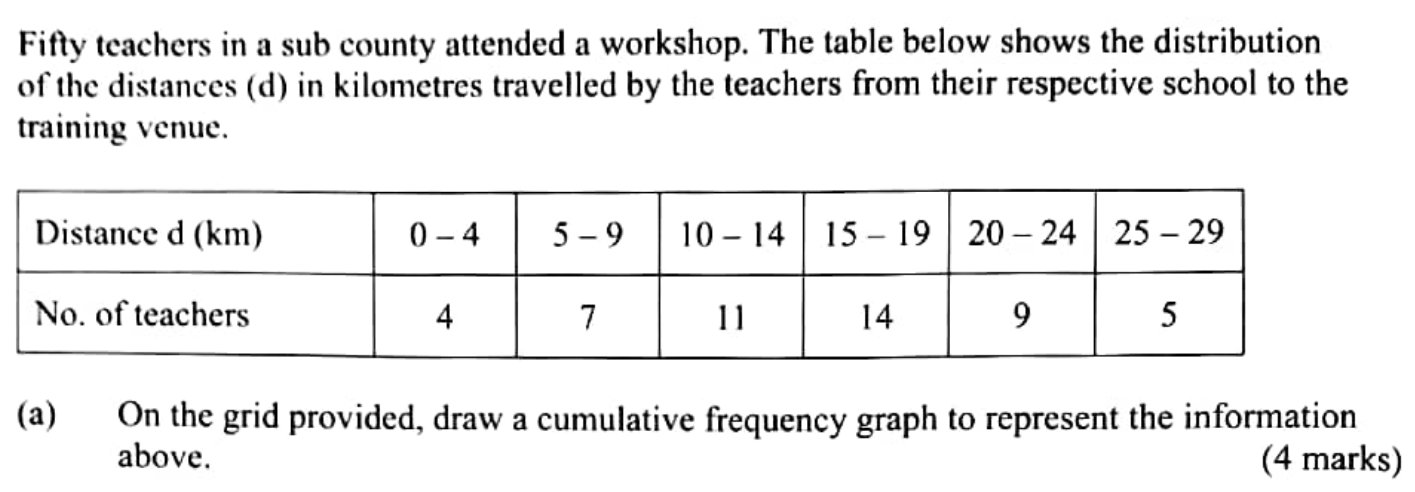
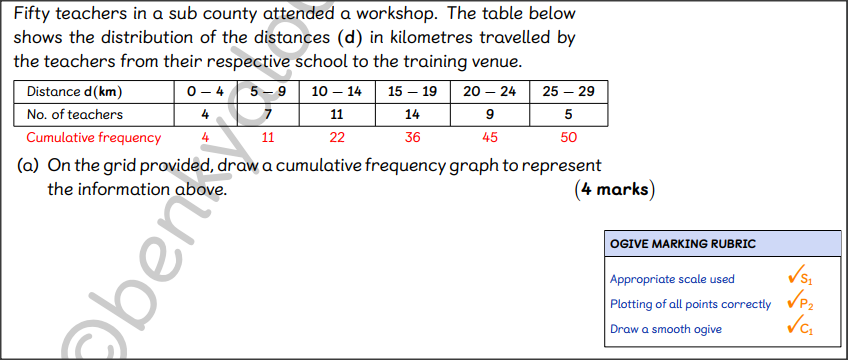
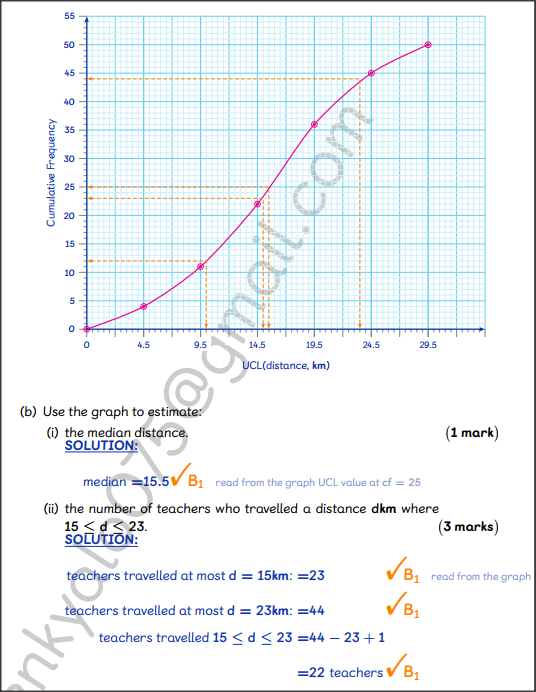
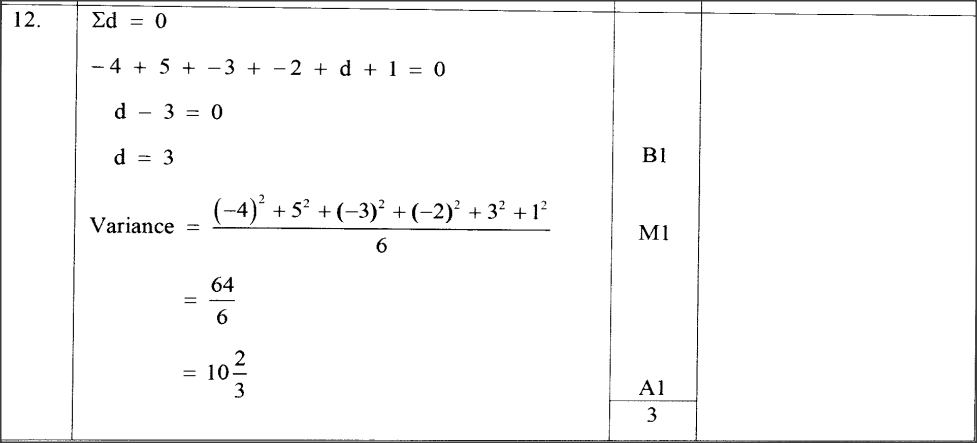
QUESTION 22 | KCSE 2022 | STATISTICS II | PAPER 2 | FORM 4 LEVELFifty teachers in a sub county attended a workshop. The table below shows the distribution of the distances (d) in kilometres travelled by the teachers from their respective school to the training venue. 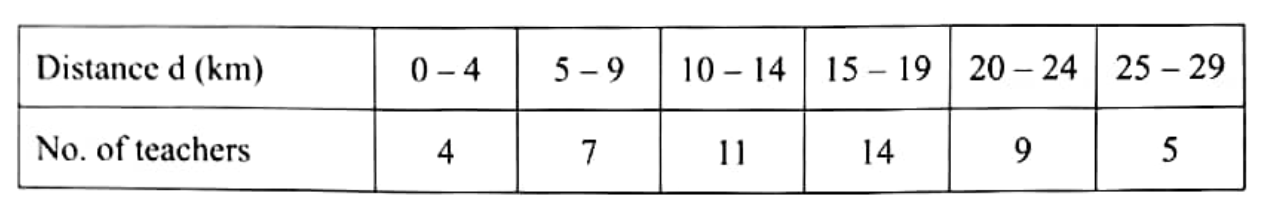
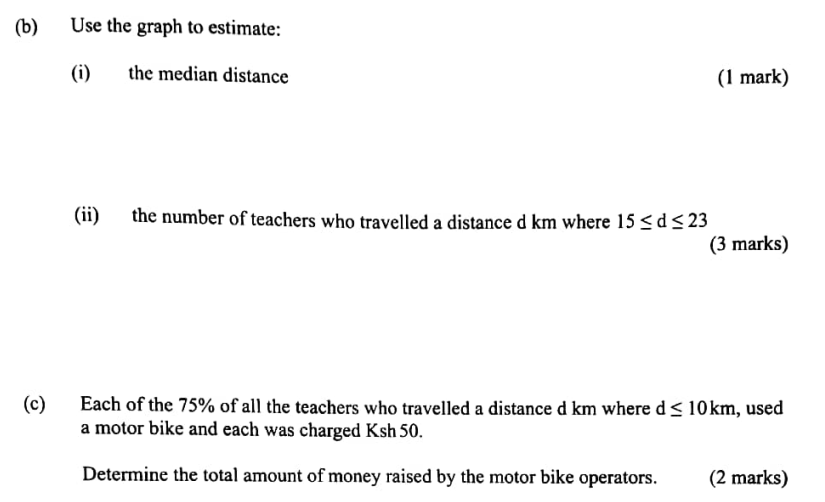
QUESTION:
MARKING SCHEME:

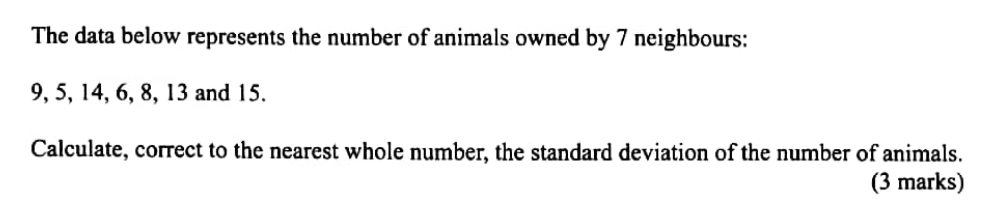
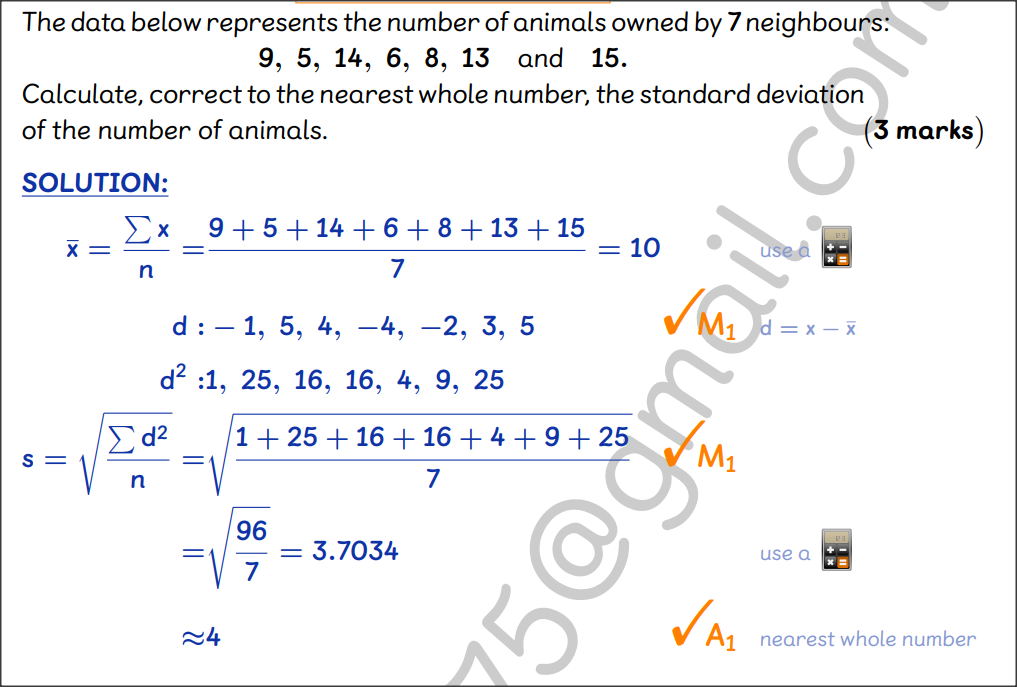
QUESTION 12 | KCSE 2022 | STATISTICS II | PAPER 2 | FORM 4 LEVELThe data below represents the number of animals owned by 7 neighbours: 9, 5, 14, 6, 8, 13 and 15. Calculate, correct to the nearest whole number, the standard deviation of the number of animals. (3 marks) MARKING SCHEME
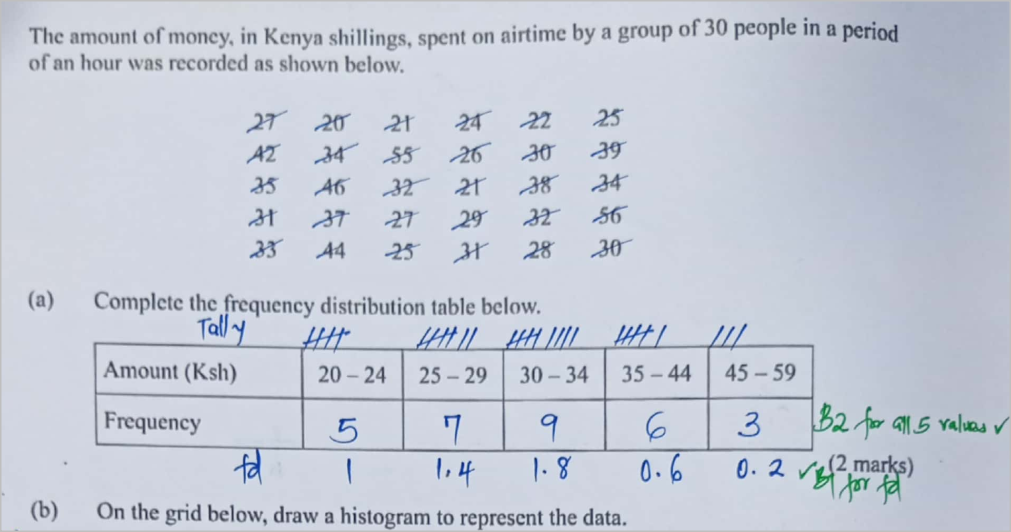
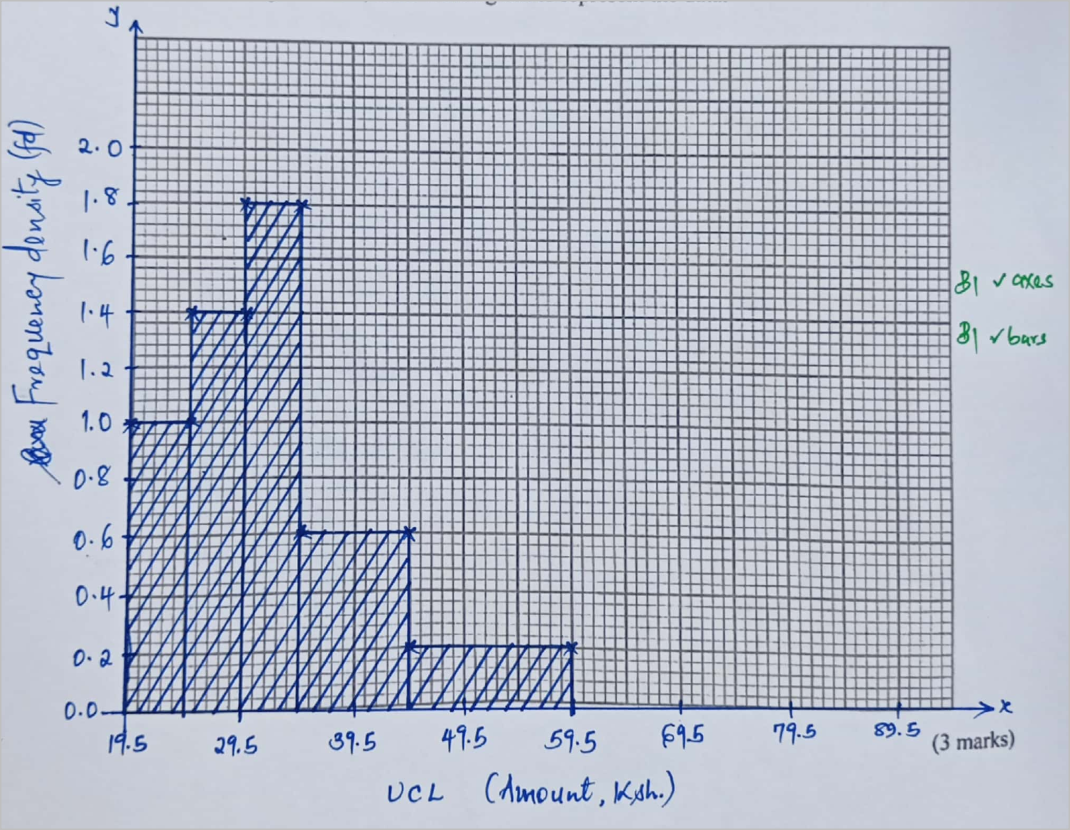
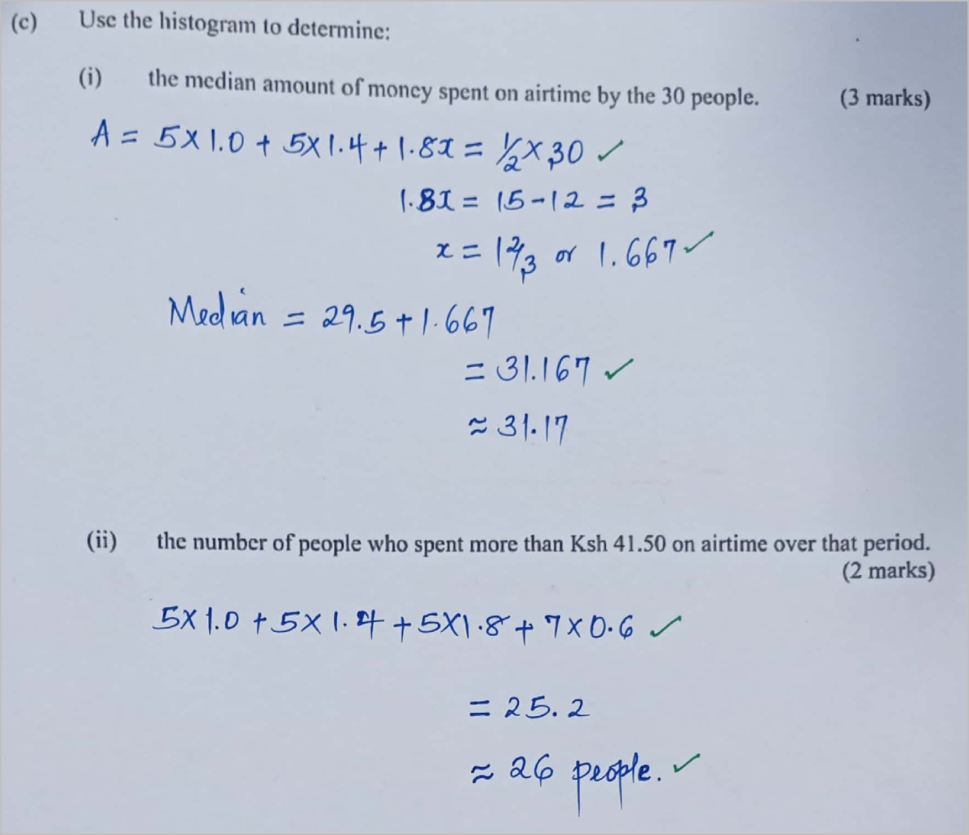
QUESTION 21 | KCSE 2022 | STATISTICS II | PAPER 1 | FORM 3 LEVELThe amount of money, in Kenya shillings, spent on airtime by a group of 30 people in a period of an hour was recorded as shown below. (a) Complete the frequency distribution table below. 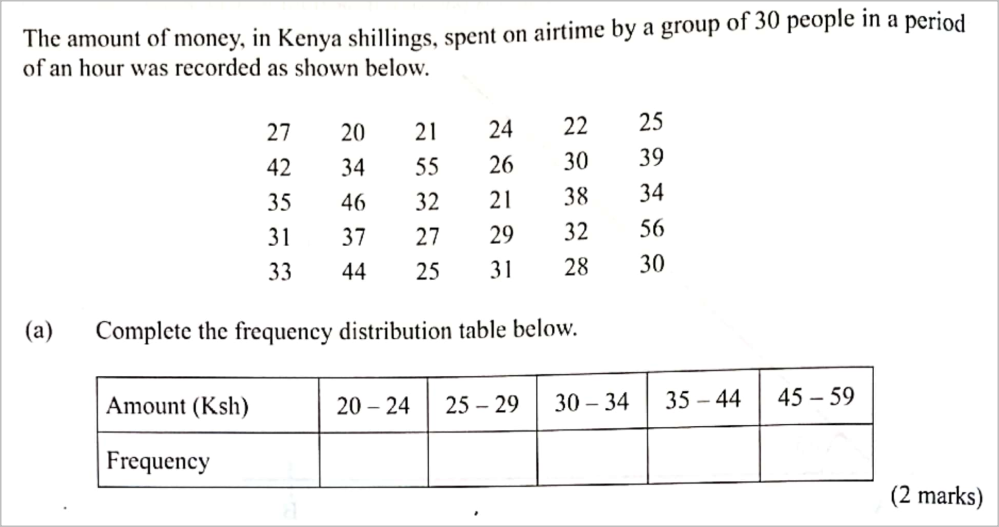   MARKING SCHEME
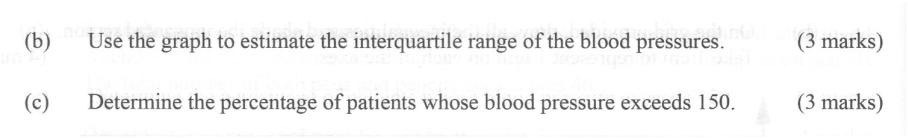
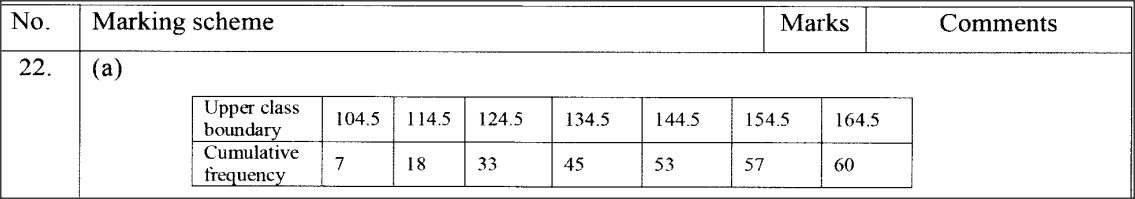
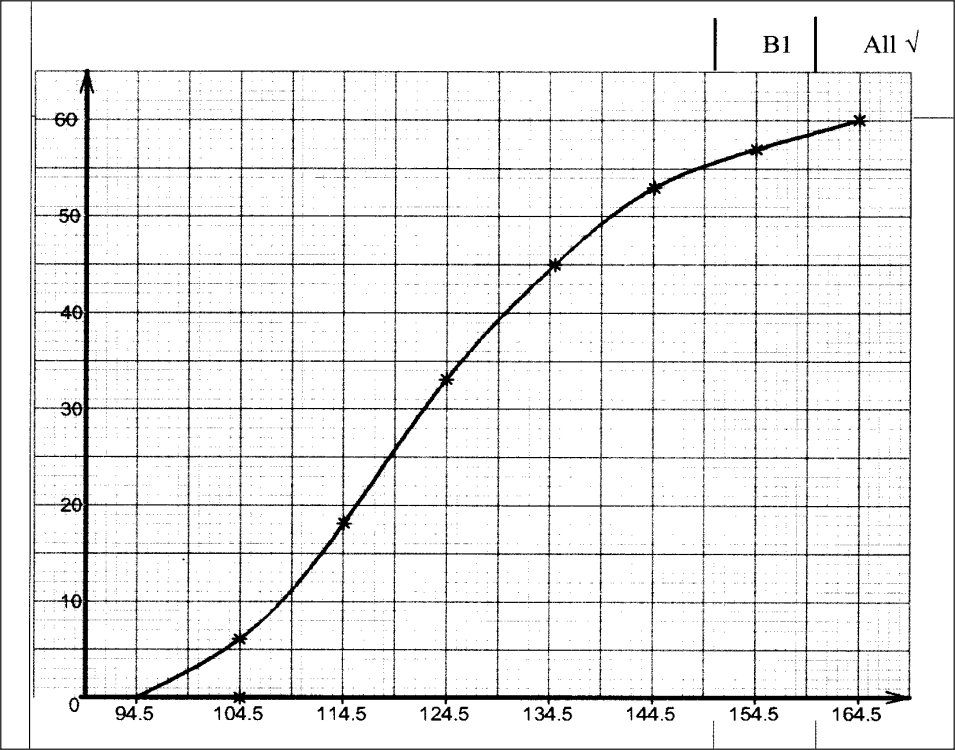
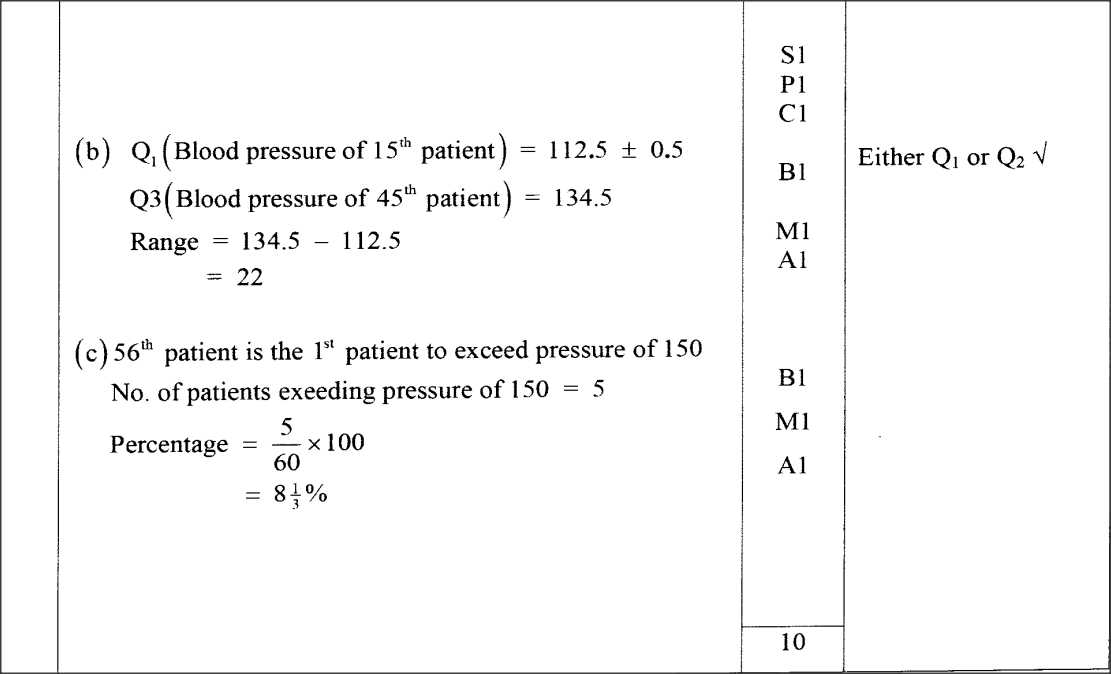
The systolic blood pressure of 60 patients attending a clinic was recorded as follows:KCSE 2020 MATHEMATICS ALT A PAPER 2 QUESTION 22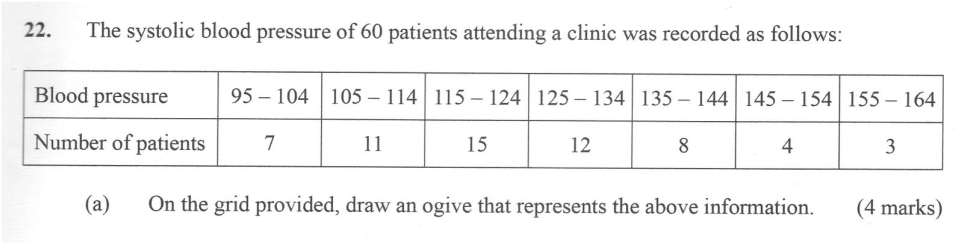
The following are marks scored by form four student in Mathematics test.
Using an assumed mean of 54.5, calculate the a) Mean mark (4mks) b) Variance (4mks) c) Standard deviation (2mks)

PAPER 1, SECTION B, STATISTICS II, FORM 4 LEVEL, 10 MARKS A number of people are asked to cut 20cm lengths of string without measuring. Later 100 pieces are collected and measured correct to the nearest 1/10cm. the data below was collected.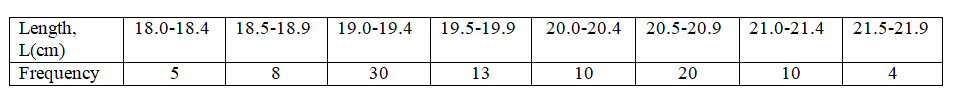
Using 19.7 as a working mean calculate:(a) Mean (4mks)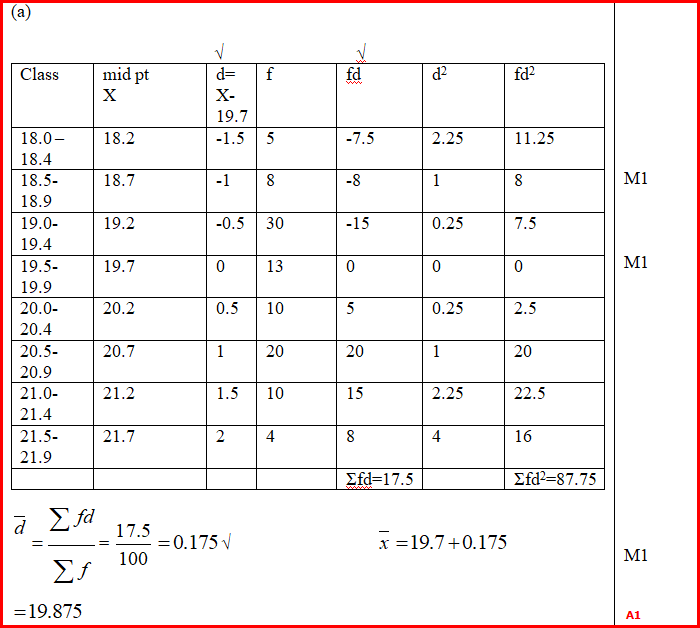
(b) Standard deviation (5mks)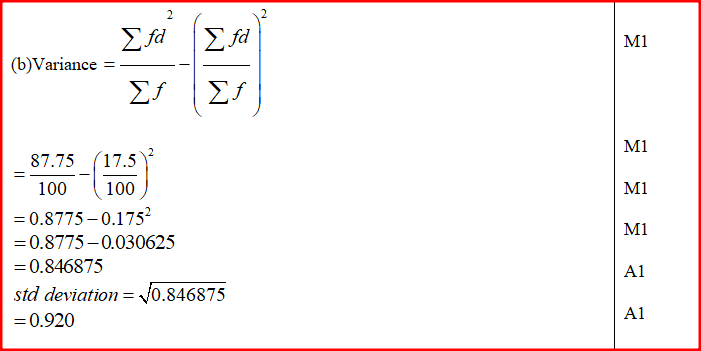
(c) State the modal class (1mk)
Form 4 Mathematics
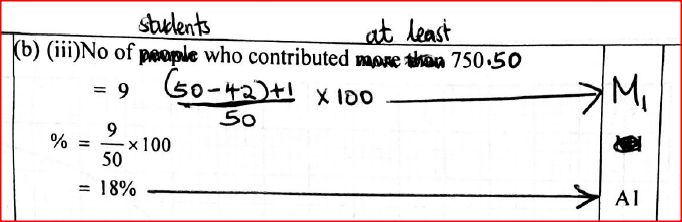
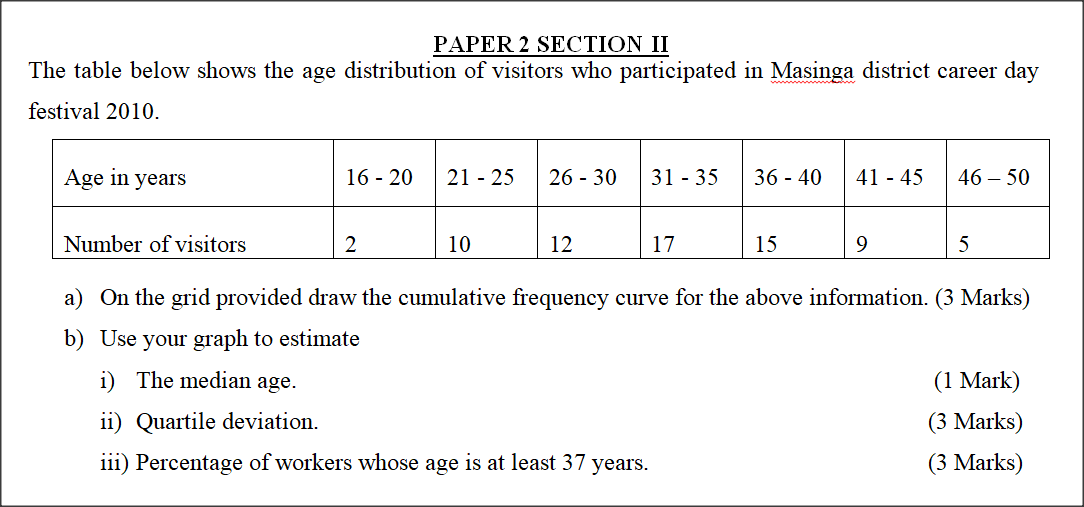
The amount of money contributed by a group of students during a fundraising for a needy student was as shown in the table below.
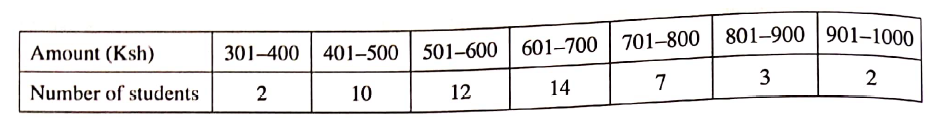
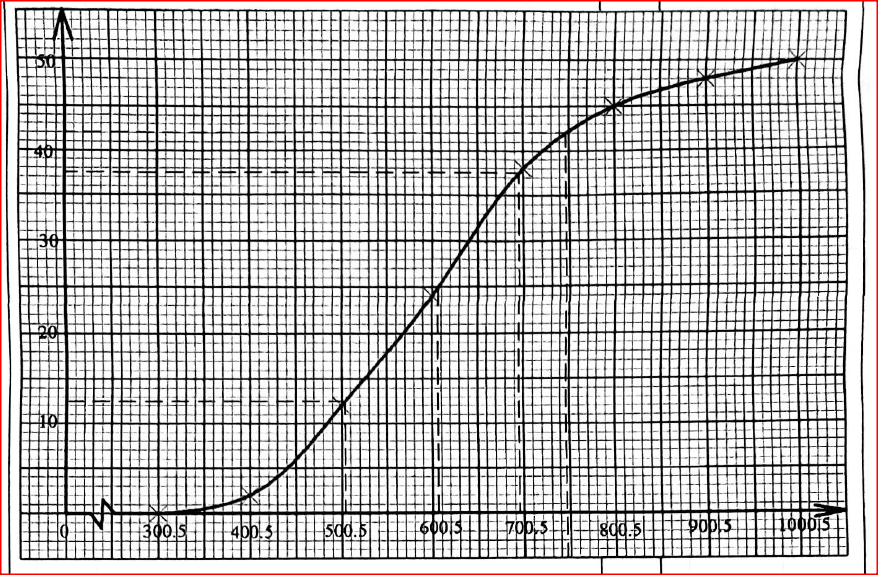
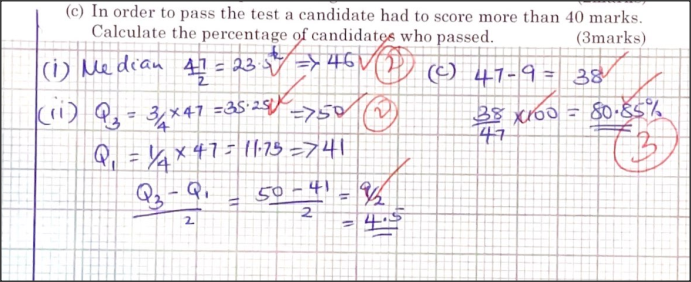
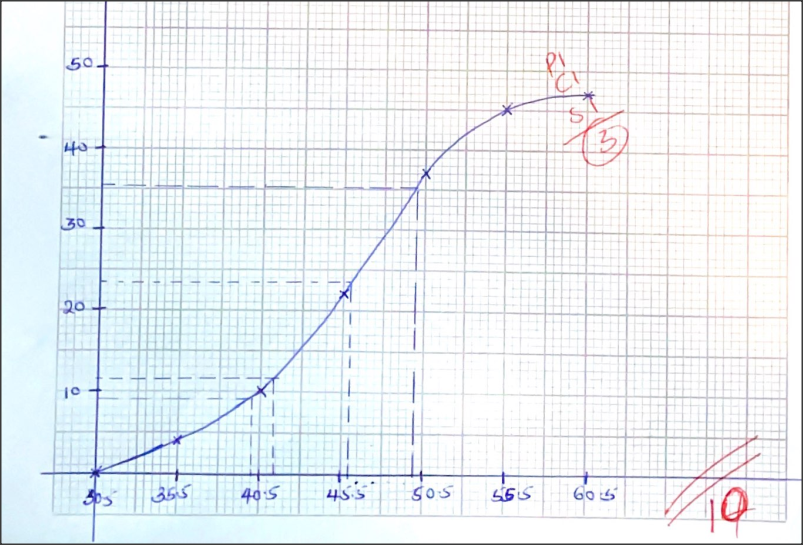
(a) On the grid provided draw an ogive to represent the data.
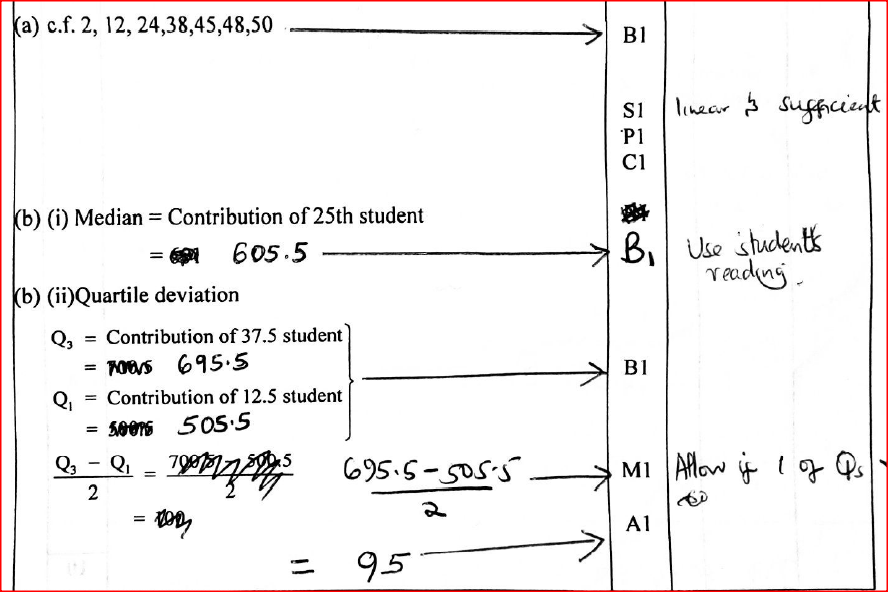
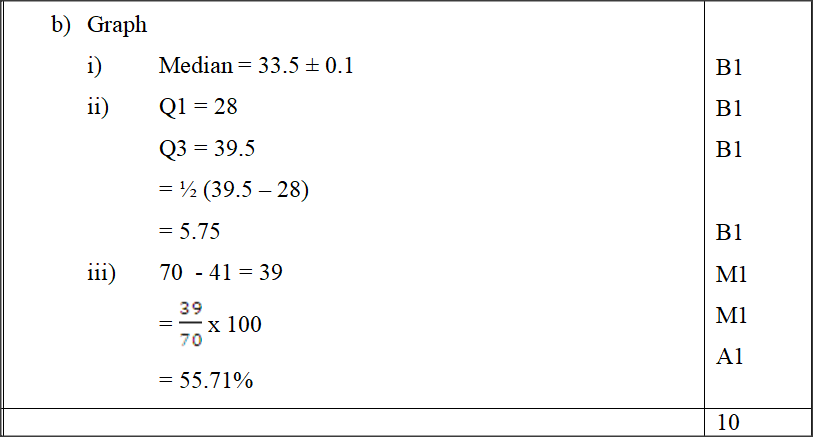
(b) Use the graph to estimate: (i) The median; (ii) The quartile deviation; (iii) The percentage number of students who contributed at least Ksh 750.50.
answers
Form 4 Mathematics
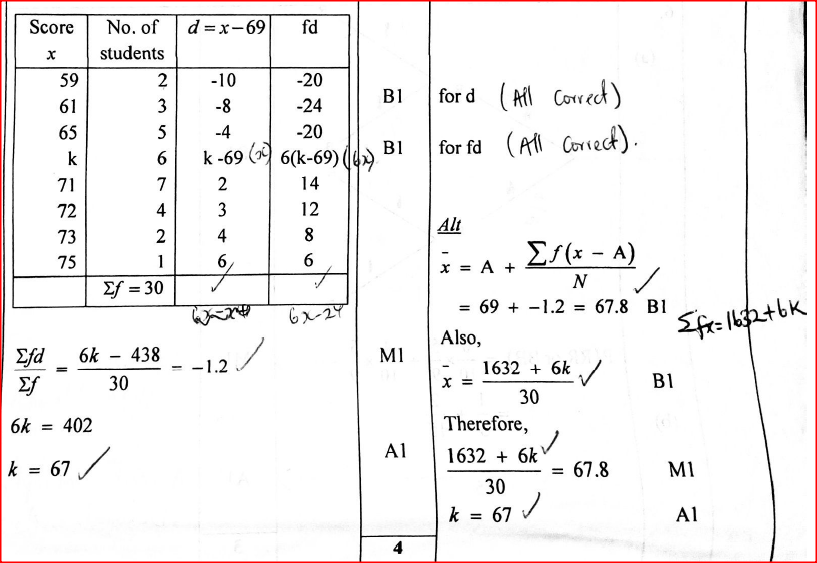
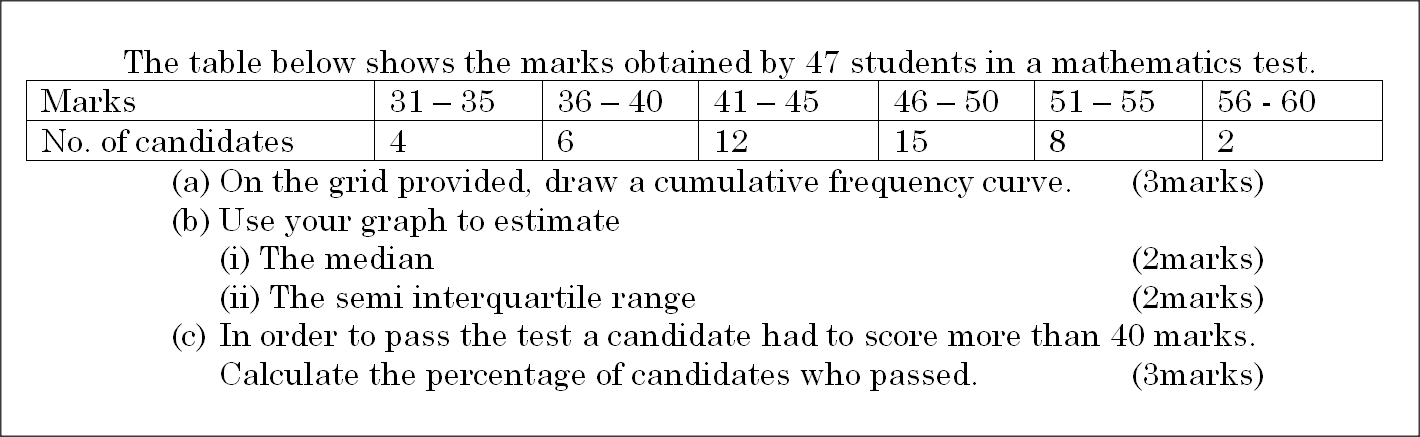
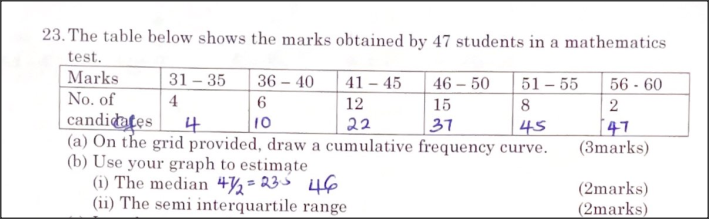
In a mathematics test, the scores obtained by 30 students were recorded as shown in the table below.
The score K with a frequency of 6 is not given. 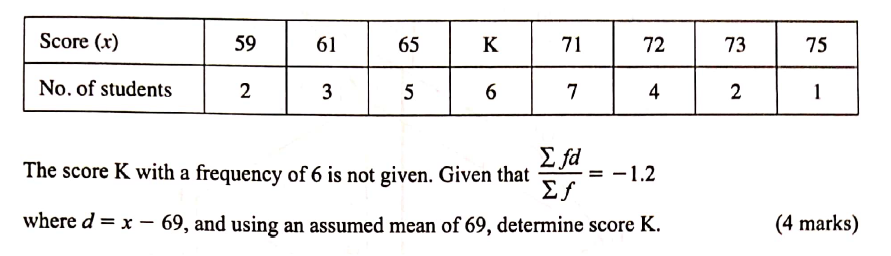
answer
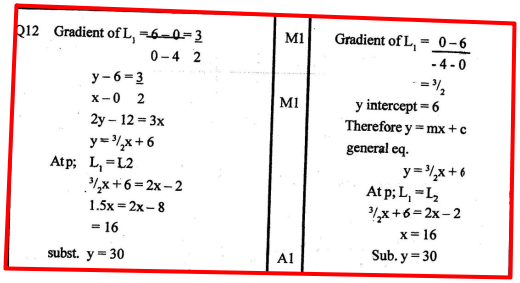
Form 4 MathematicsTwo lines L1 and L2 intersect at a point P. L1 passes through the points (-4,0) and (0,6). Given that L2 has the equation: y = 2x – 2, find, by calculation, the coordinates of P. ( 3 marks)
Answer
Form 4 Mathematics
The table below shows the frequency distribution of heights of 40 plants in a tree nursery.
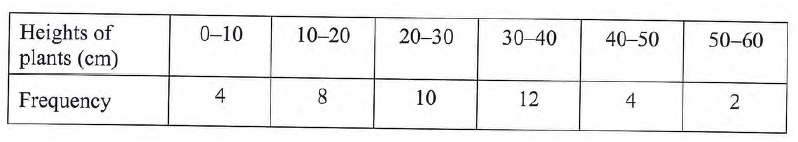
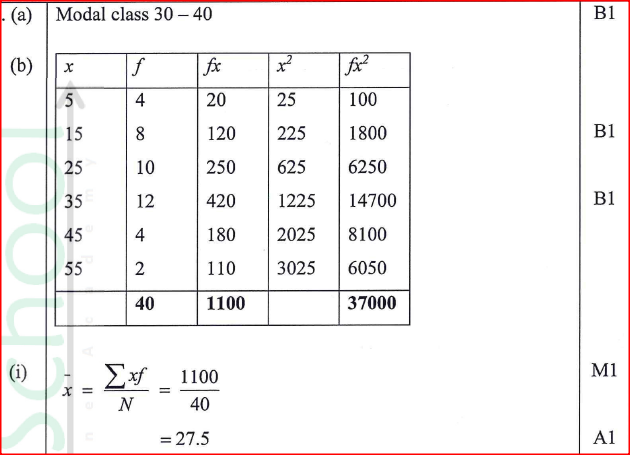
(a) State the modal class.
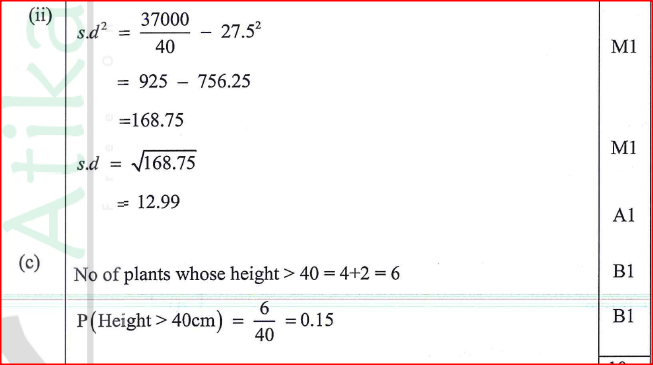
(b) Calculate: (i) the mean height of the plants; (ii) the standard deviation of the distribution. (c) Determine the probability that a plant taken at random has a height greater than 40 cm.
answers
Form 4 Mathematics
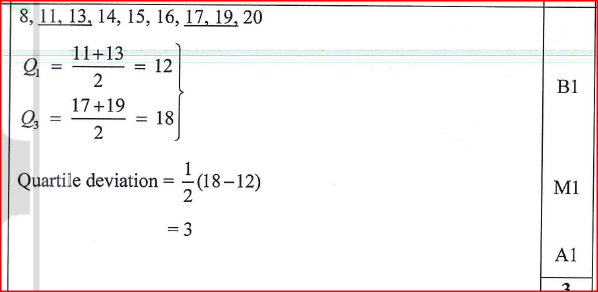
The mass, in kilograms, of 9 sheep in a pen were: 13, 8, 16, 17, 19, 20, 15, 14 and 11.
Determine the quartile deviation of the data.
answer
Form 1 MathematicsSuccessive moving averages of order 5 for the numbers 9,8.2, 6.7,5.4, 4.7 and k are A and B. Given that A – B = 0.6 find the value of k.
Answer

Form 4 MathematicsThe data below shows the masses in grams of 50 potatoes 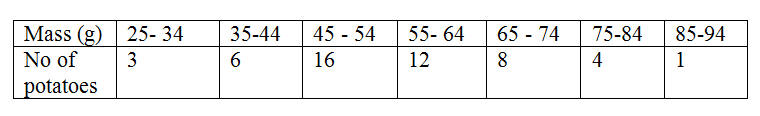
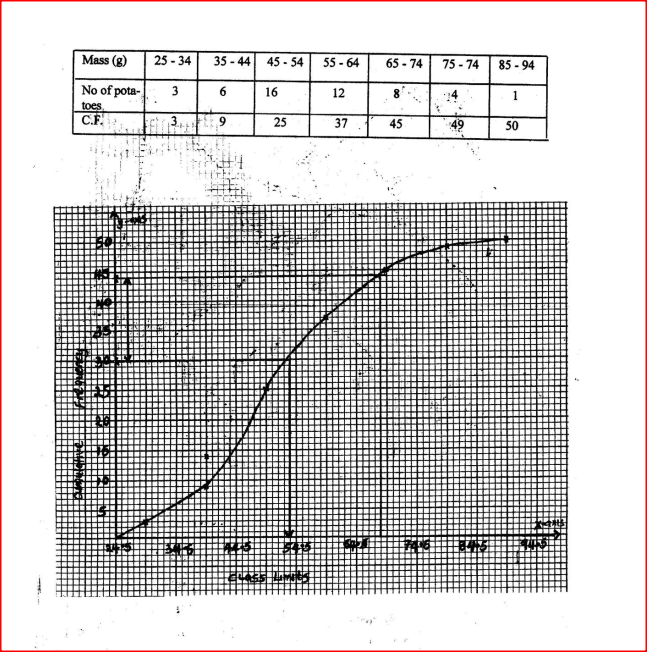
(a) On the grid provide, draw a cumulative frequency curve for the data (4mks) (b) Use the graph in (a) above to determine (i) The 60th percentile mass (ii) The percentage of potatoes whose masses lie in the range 53 g to 68g (3mks)
Answer
Form 4 Mathematics
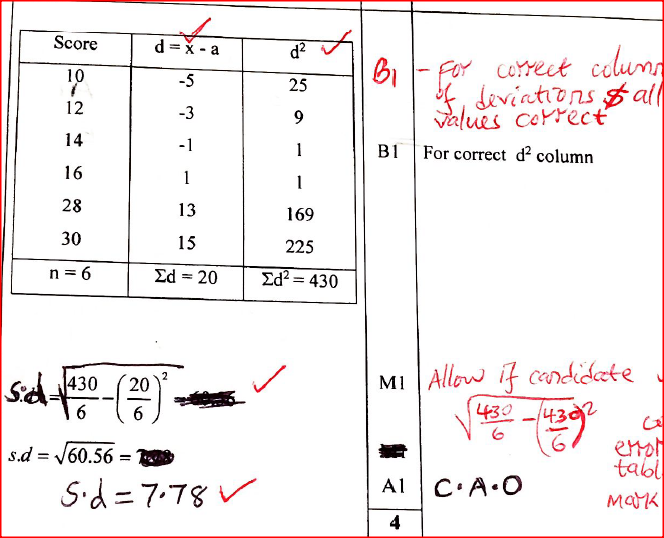
A basket ball team scored the points in 6 matches: 10, 12, 14, 16, 28 and 30. Using an assumed mean of l5. Determine the standard deviation correct to 2 decimal places.
answer
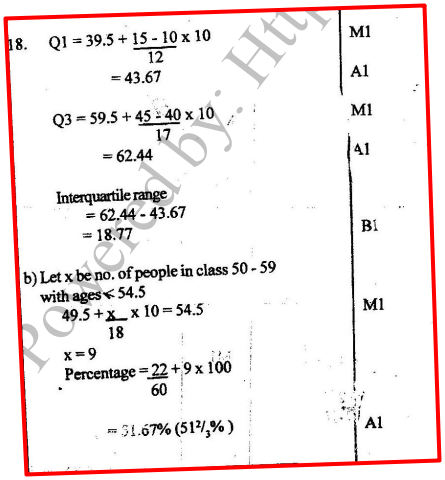
Form 3 Mathematics
The table below shows the ages in years of 60 people who attended a conference.
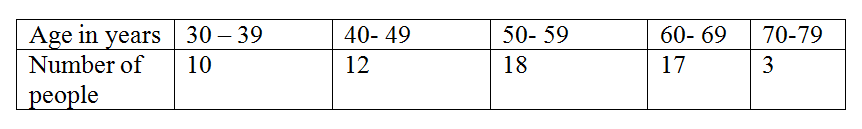
Calculate
(a)The inter-quartile range of the data (b)The percentage of the people in the conference whose ages were 54.5 years and below.
Answer
Form 2 Mathematics
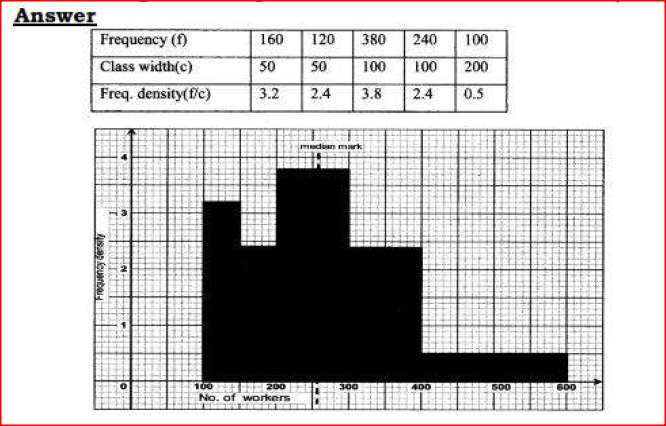
The frequency table below shows the daily wages paid to casual workers by a certain company

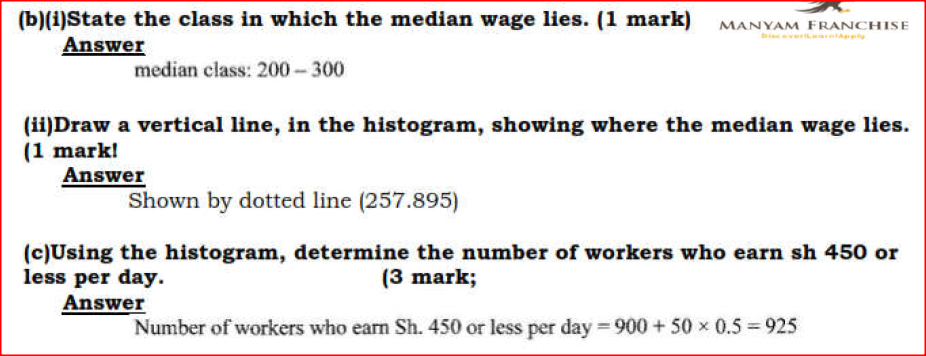
a) In the grid provided, draw a histogram to represent the above information
b.i)State the class in which the median wage lies ii) Draw a vertical line, in the histogram, showing where the median wage lies c) Using the histogram, determine the number of workers who earn shs 450 or less per day
answers
|

Categories
All
Archives
December 2024
Latest Posts |
|
Primary Resources
College Resources
|
Secondary Resources
|
Contact Us
Manyam Franchise
P.O Box 1189 - 40200 Kisii Tel: 0728 450 424 Tel: 0738 619 279 E-mail - sales@manyamfranchise.com |


 RSS Feed