KCSE MATHEMATICS QUESTIONS AND SOLUTIONS ~ Topically Analyzed
Comprehensive Answers and Marking Schemes KNEC Certified
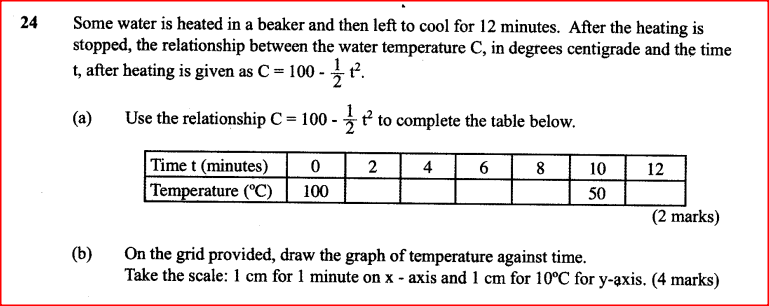
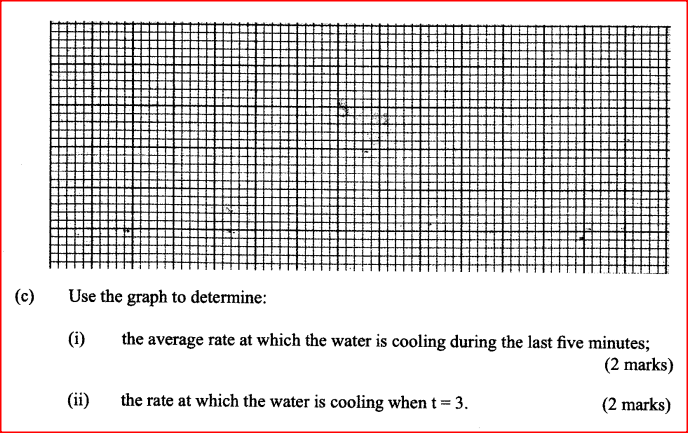
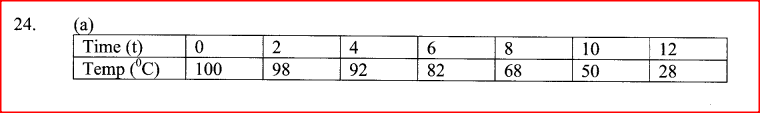
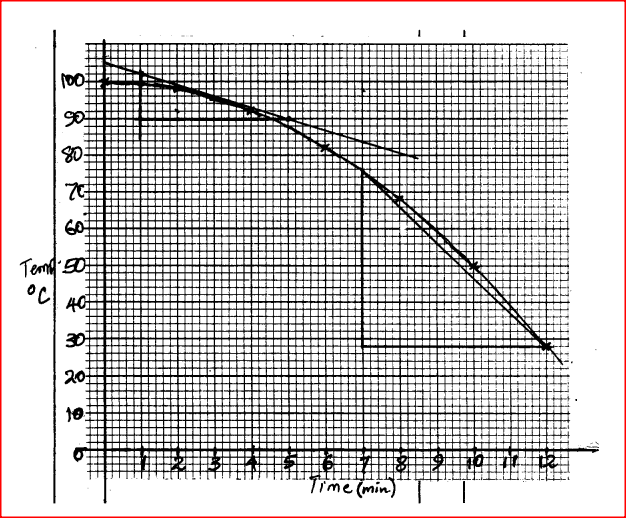
ALT B | GRAPHICAL METHODS | | FORM 3 LEVEL | SECTION II | PAPER 2 | KCSE 2010 | QUESTION 24Some water is heated in a beaker and then left to cool for 12 minutes. After the heating is stopped, the relationship between the water temperature C, in degrees centigrade and the time t, after heating is given as C = 100 -1/2 T^2.
  ANSWER
0 Comments
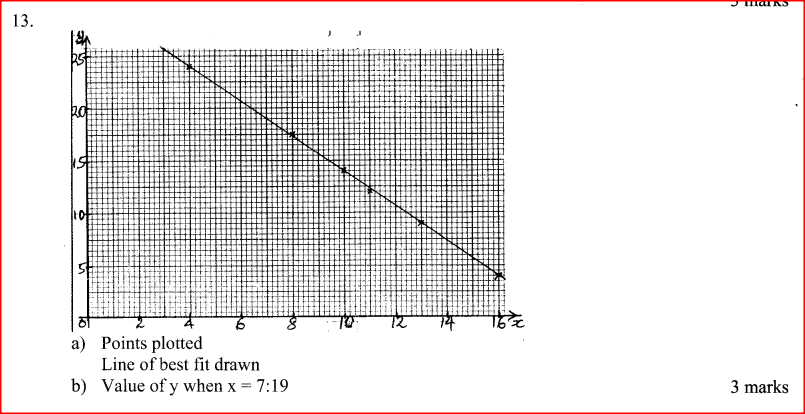
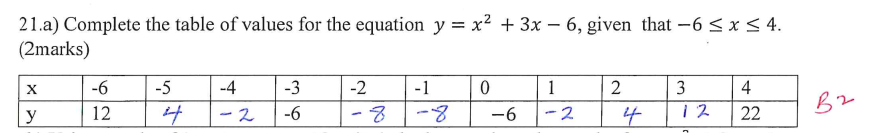
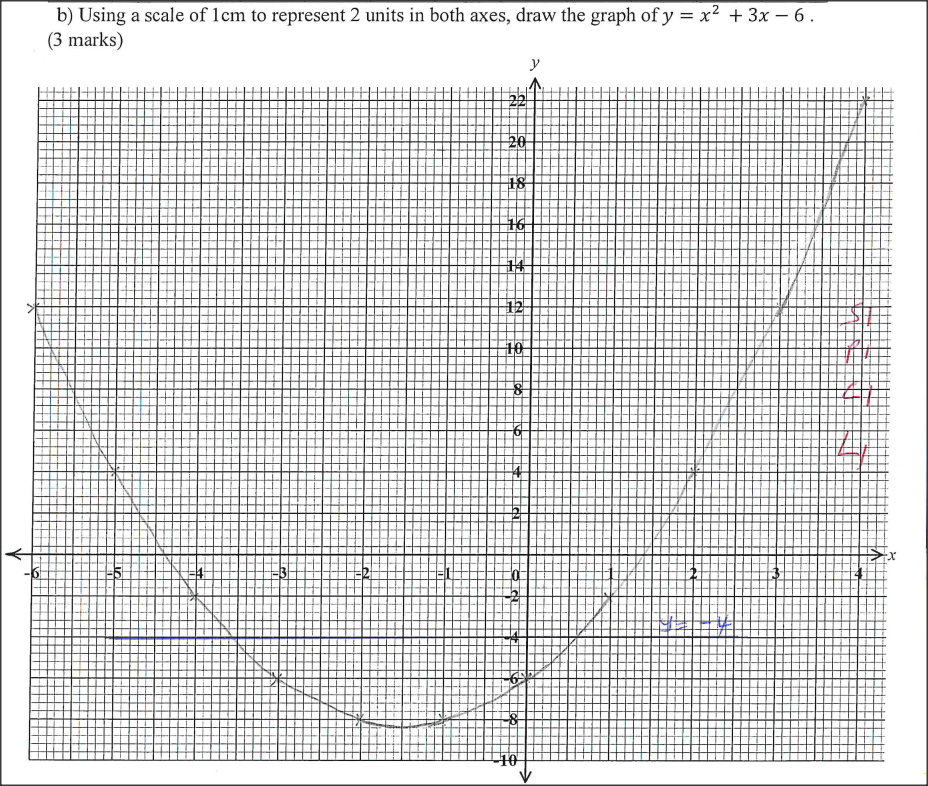
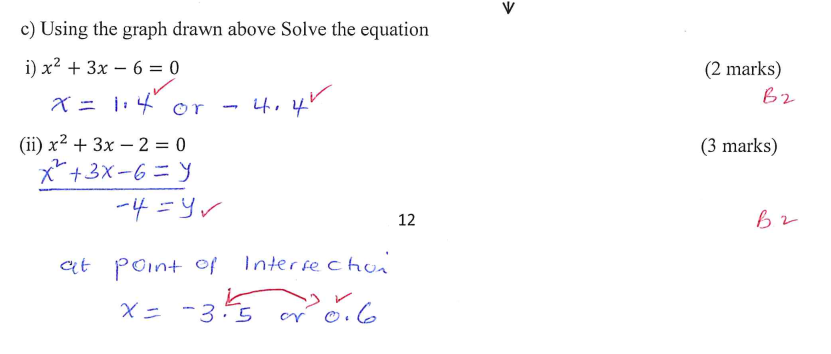
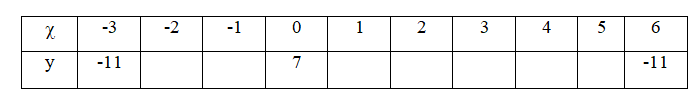
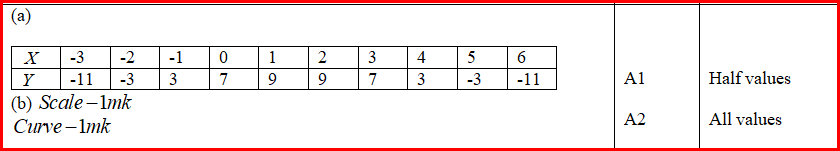
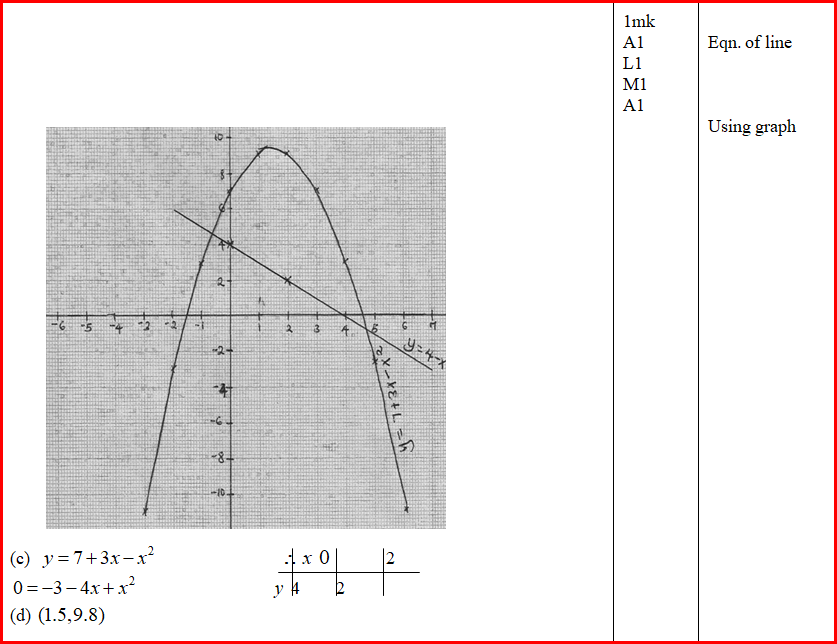
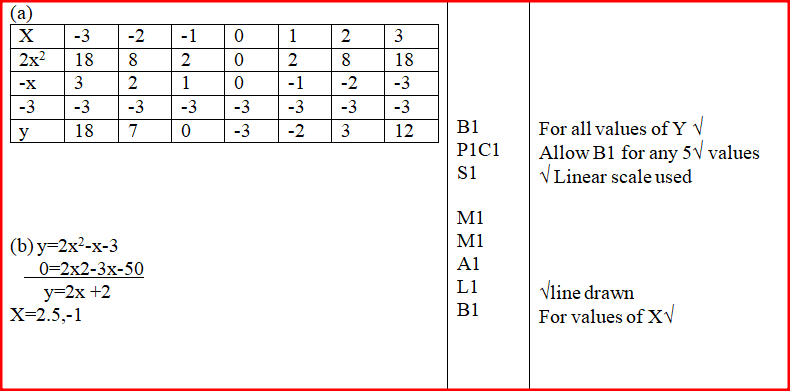
ALT B | graphical methods | | FORM 3 LEVEL | SECTION 1 | PAPER 2 | KCSE 2010 | QUESTION 13The table below gives values of two variables x and y obtained from an experiment. (a) On the grid provided below, plot the values of y against x and draw the line of best fit. (2 marks) 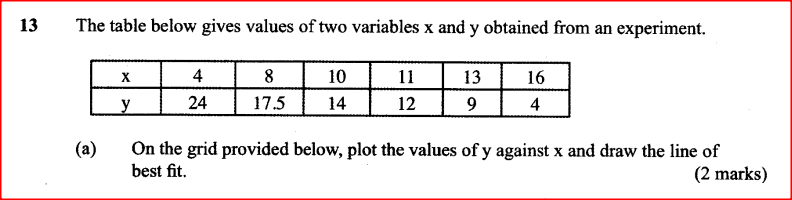 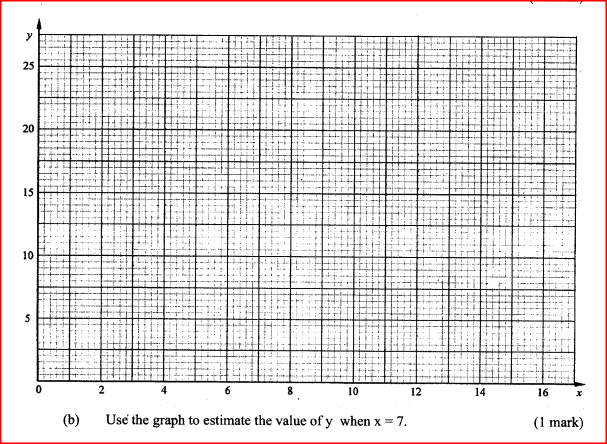 answers
QUESTION 9 | KCSE 2023 | GRAPHICAL METHODS | PAPER 2 | FORM 3 LEVELThe following figure shows a circle centre O. 
QUESTION:

MARKING SCHEME:

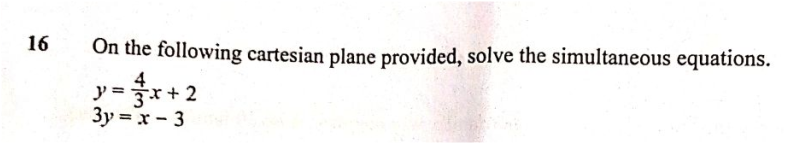
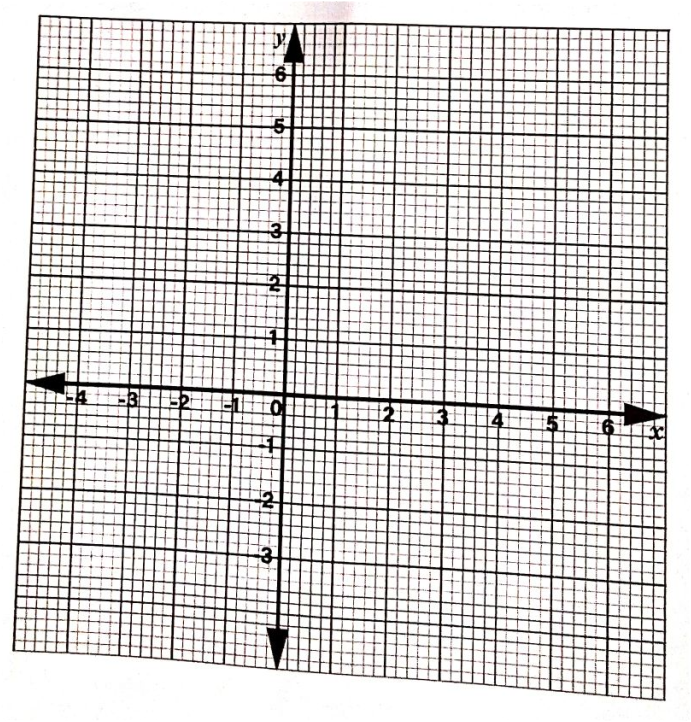
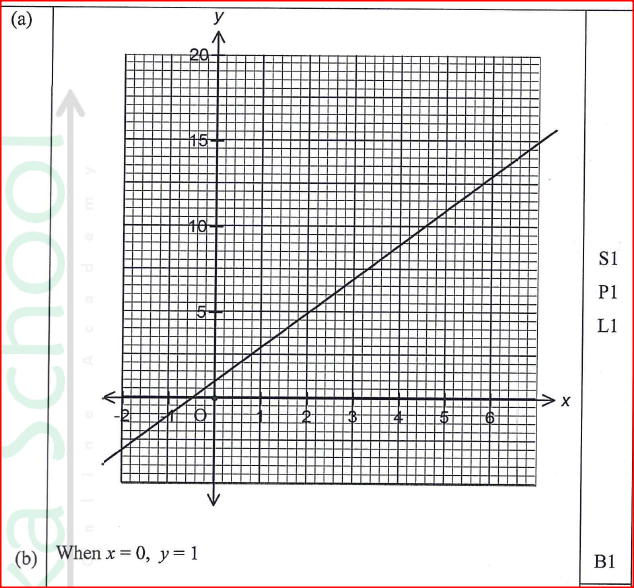
QUESTION 16 | KCSE 2023 | GRAPHICAL METHODS | PAPER 1 | FORM 3 LEVELOn the following cartesian plane provided, solve the simultaneous equations. y = 4/3 x + 2; 3y = x - 3  QUESTION:
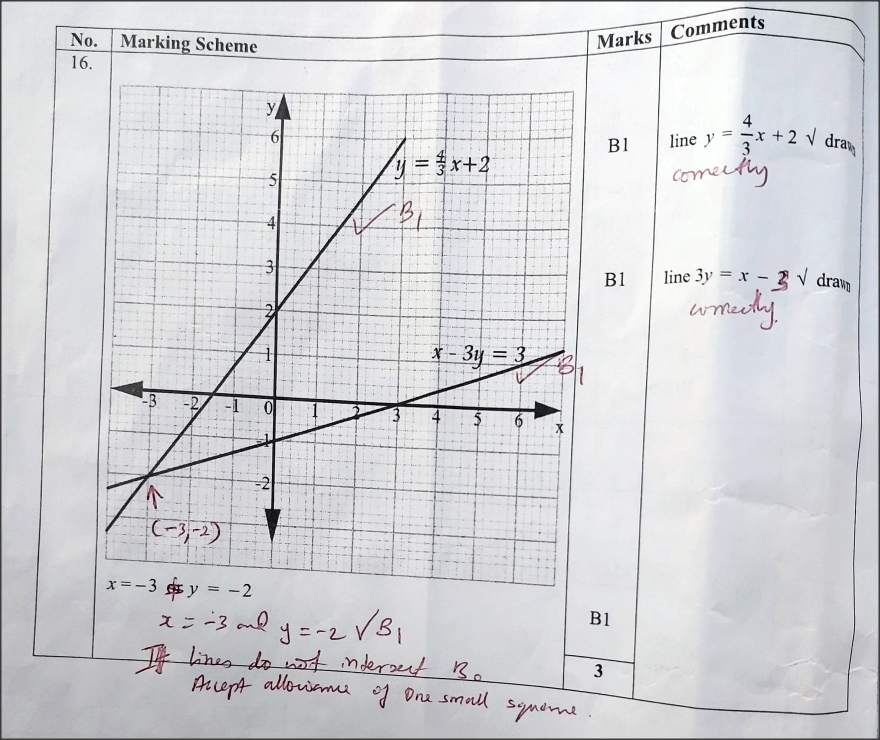
MARKING SCHEME:
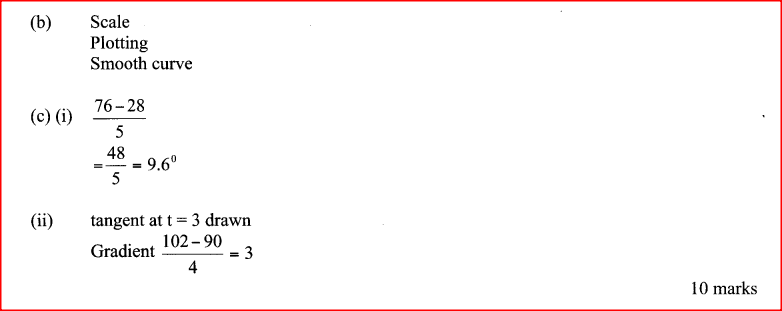
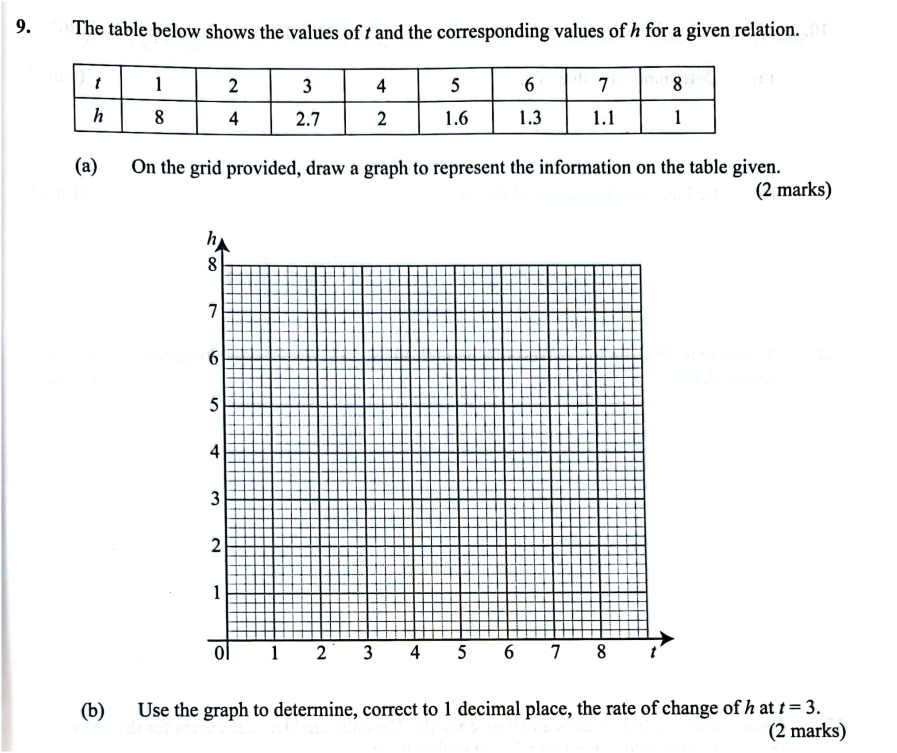
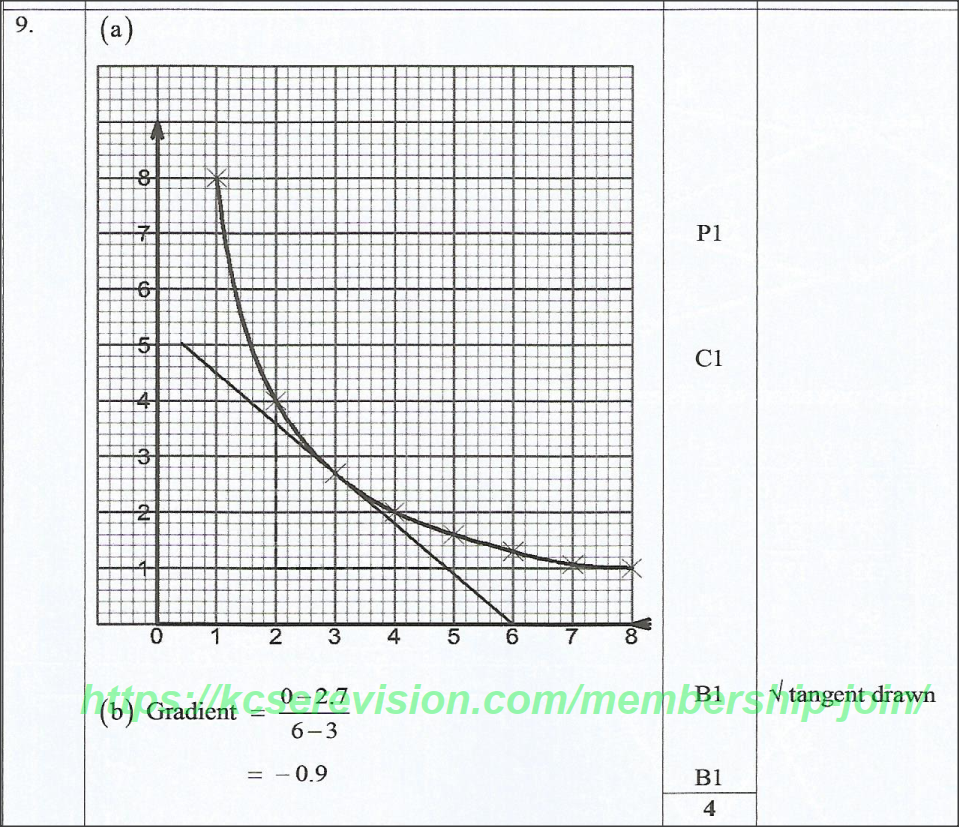
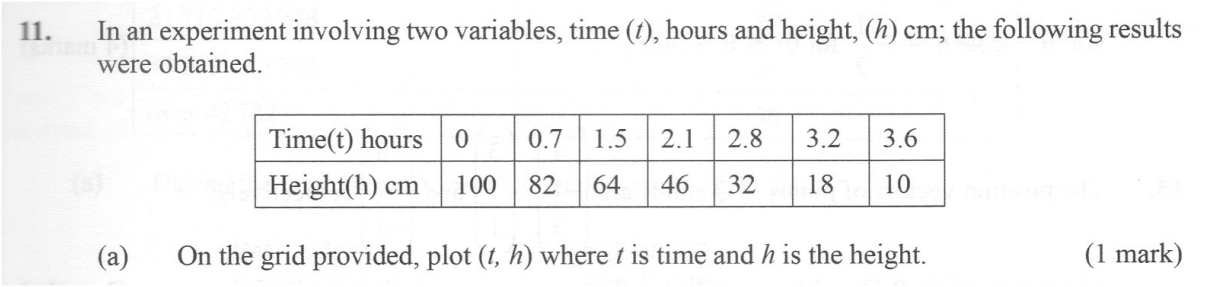
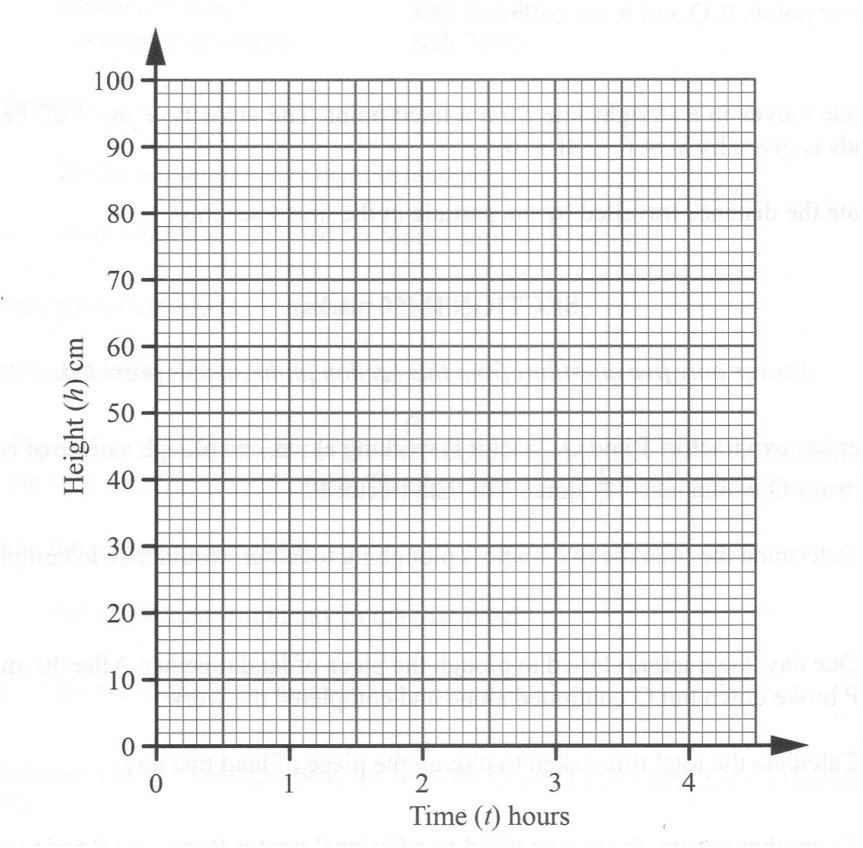
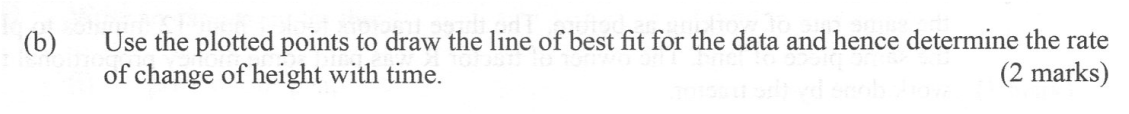
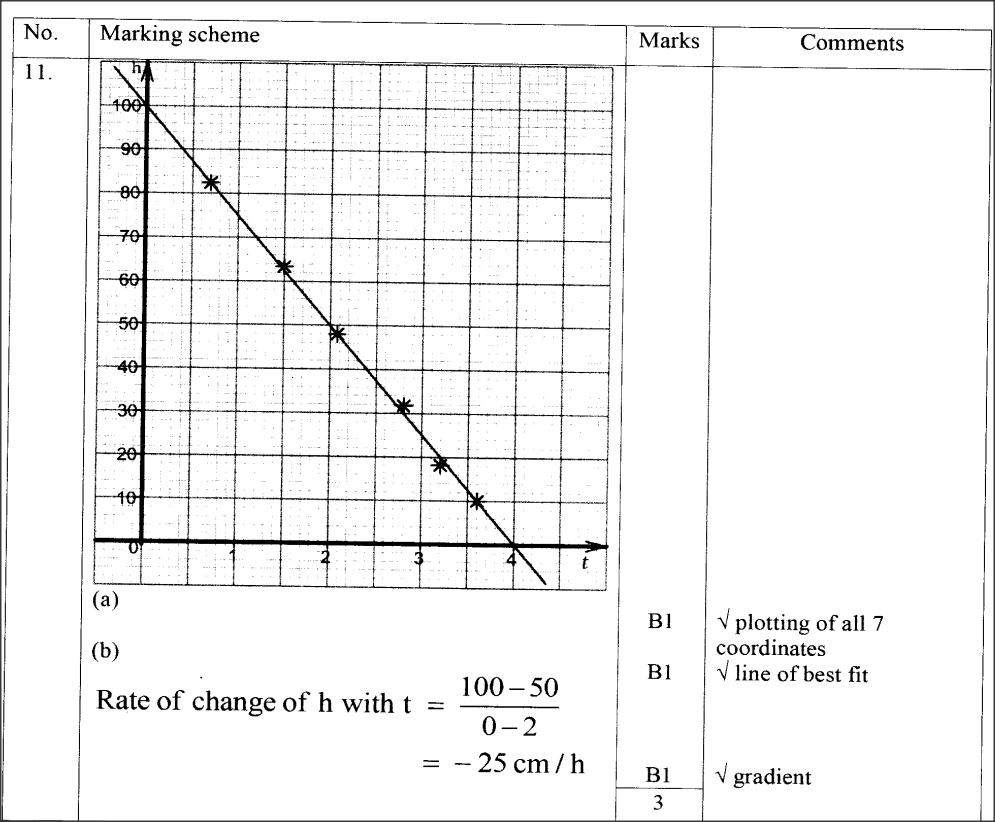
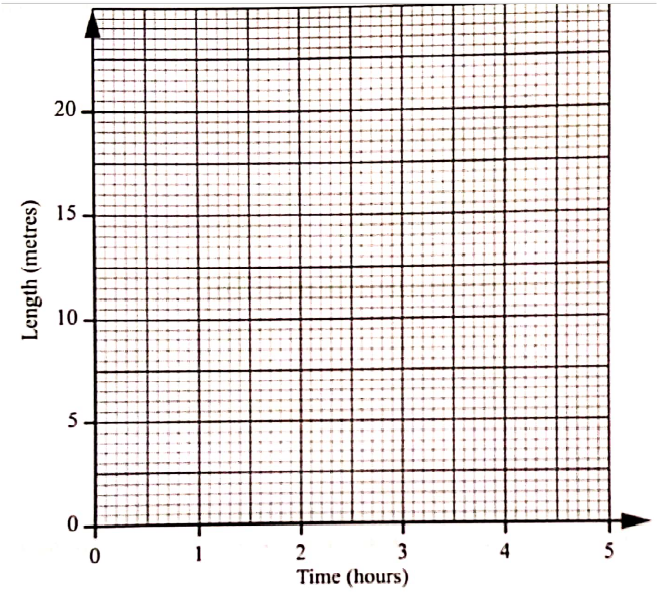
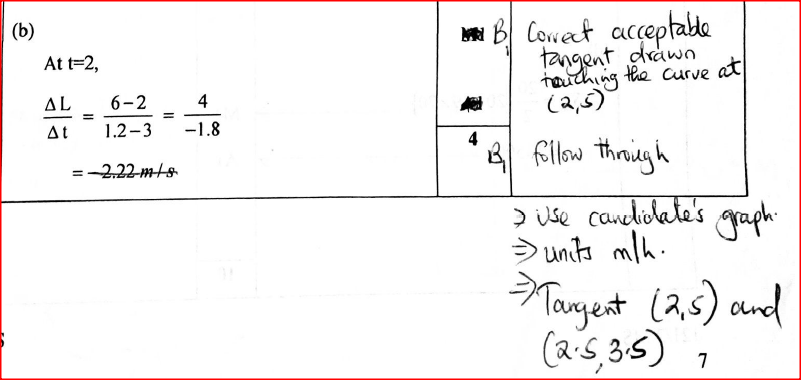
The table below shows the values of t and the corresponding values of h for a given relation28/12/2023 QUESTION 9 | KCSE 2021 | GRAPHICAL METHODS | PAPER 2 | FORM 3 LEVELThe table below shows the values of t and the corresponding values of h for a given relation. 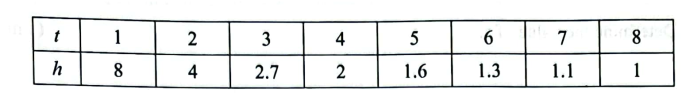 (a) On the grid provided, draw a graph to represent the information on the table given. (2 marks) 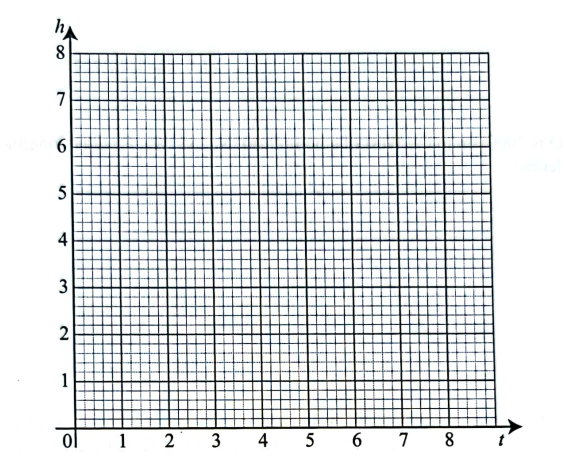 (b) Use the graph to determine, correct to 1 decimal place, the rate of change of h at t = 3. (2 marks) QUESTION:
MARKING SCHEME:
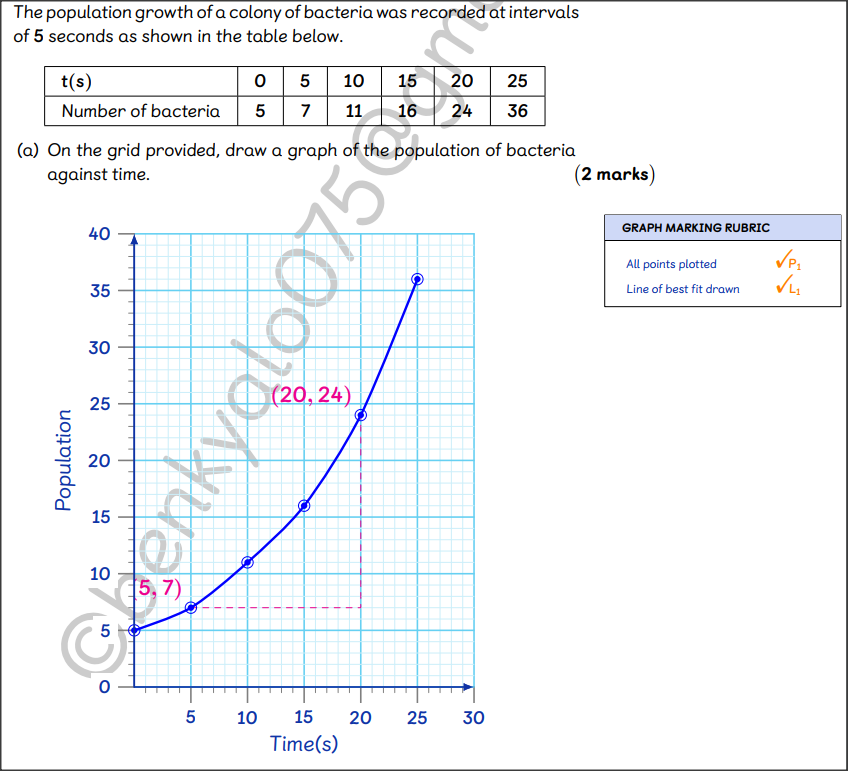
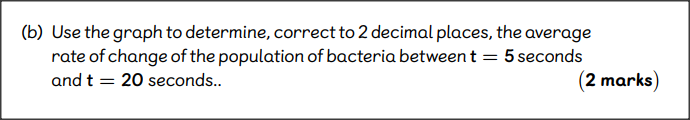
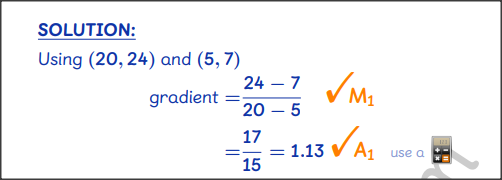
QUESTION 9 | KCSE 2022 | GRAPHICAL METHODS | PAPER 2 | FORM 3 LEVELThe population growth of a colony of bacteria was recorded at intervals of 5 seconds(s) as shown in the table below (a) On the grid provided, draw a graph of the population of bacteria against time. (2 marks) 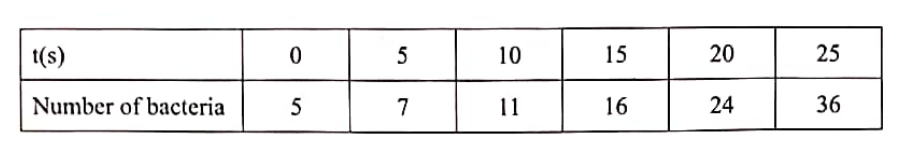 (b) Use the graph to determine, correct to 2 decimal places, the average rate of change of the population of bacteria between t = 5 seconds and t = 20 seconds. (2 marks) 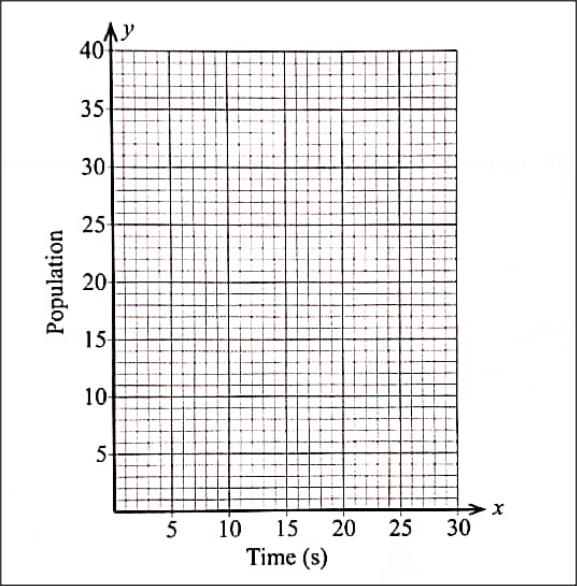 MARKING SCHEME
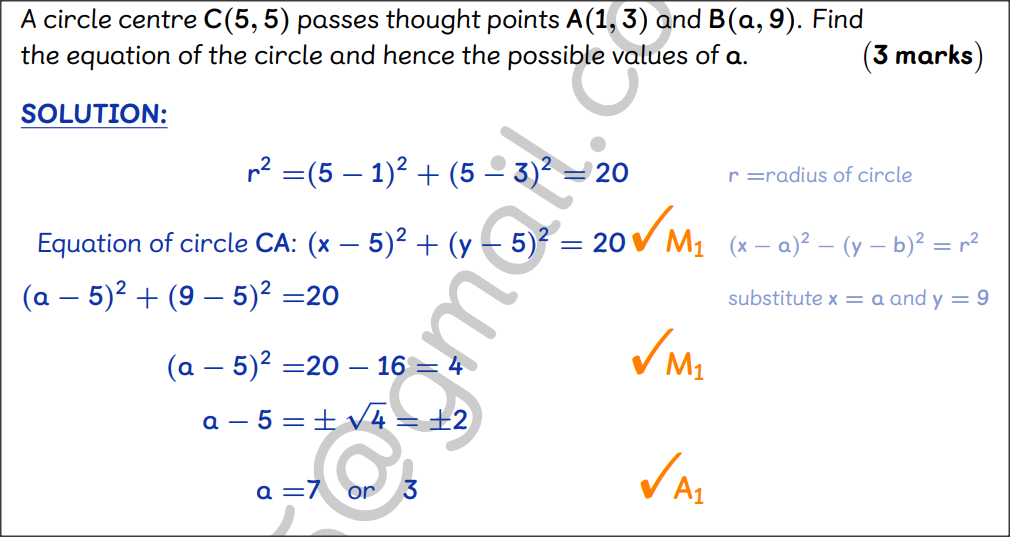
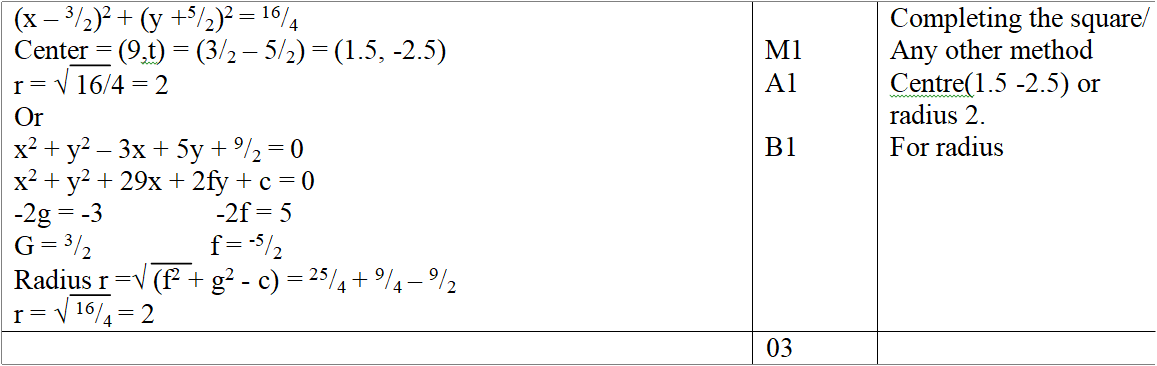
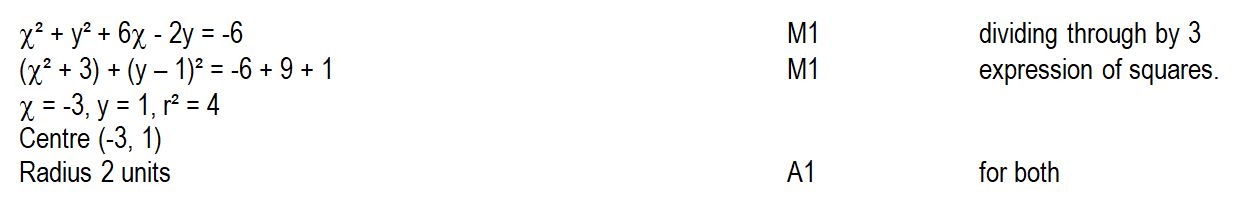
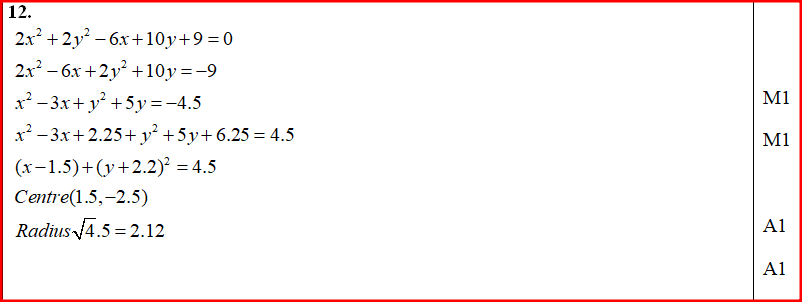
QUESTION 10 | KCSE 2022 | GRAPHICAL METHODS | PAPER 2 | FORM 3 LEVEL A circle centre C(5, 5) passes through points A(1, 3) and B(a, 9). Find the equation of the circle and hence the possible values of a. (3 marks) MARKING SCHEME

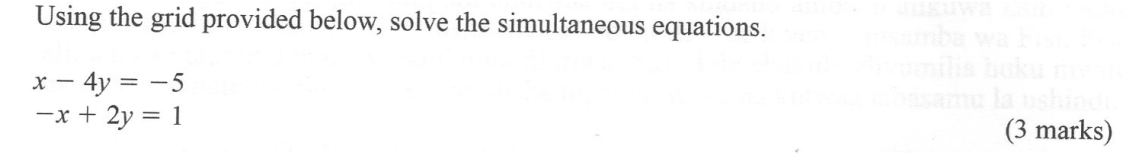
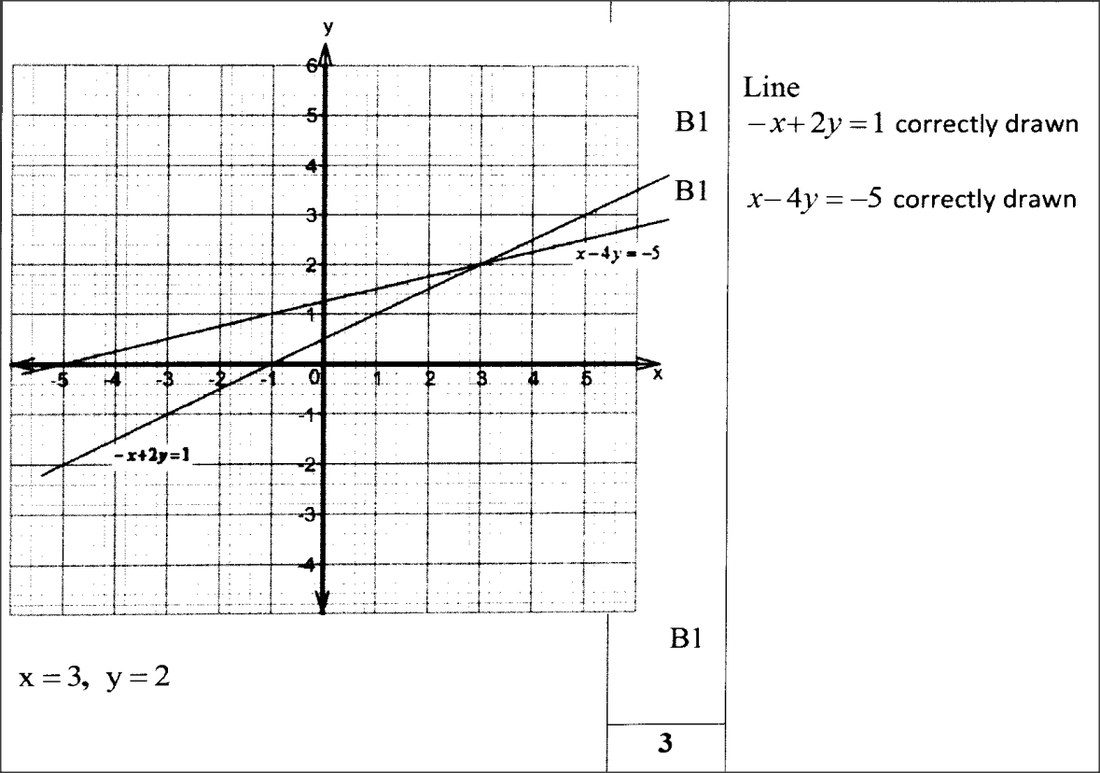
Using the grid provided below, solve the simultaneous equations.
|

Categories
All
Archives
December 2024
Latest Posts |
|
Primary Resources
College Resources
|
Secondary Resources
|
Contact Us
Manyam Franchise
P.O Box 1189 - 40200 Kisii Tel: 0728 450 424 Tel: 0738 619 279 E-mail - sales@manyamfranchise.com |


 RSS Feed