KCSE MATHEMATICS QUESTIONS AND SOLUTIONS ~ Topically Analyzed
Comprehensive Answers and Marking Schemes KNEC Certified
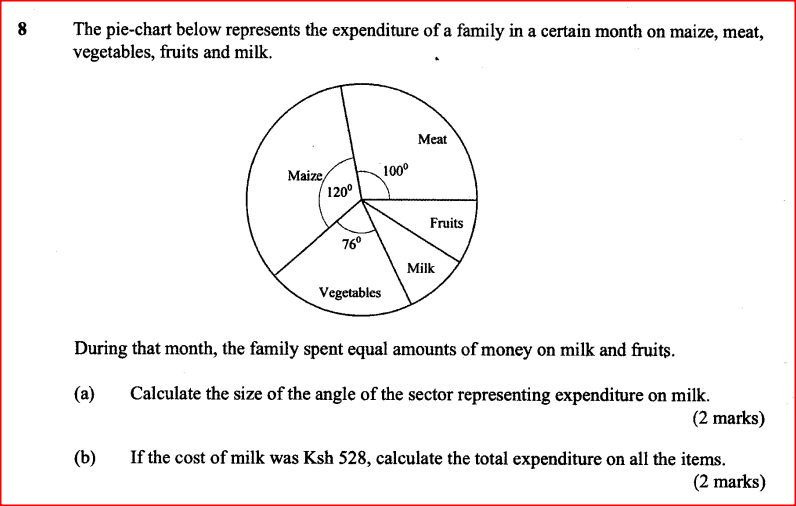
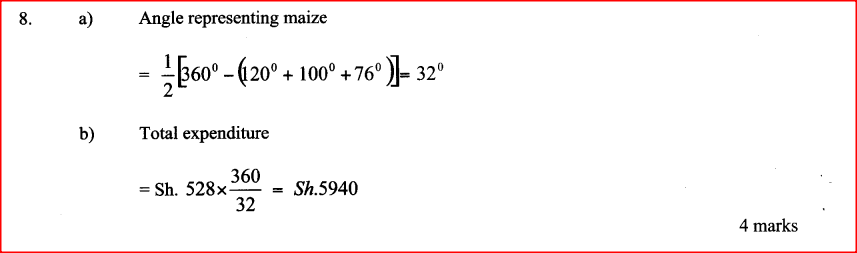
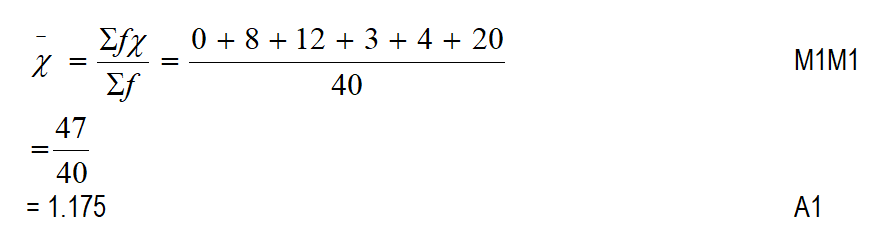
ALT B | STATISTICS I | | FORM 2 LEVEL | SECTION 1 | PAPER 2 | KCSE 2010 | QUESTION 8The pie-chart below represents the expenditure of a family in a certain month on maize, meat, vegetables, fruits and milk. During that month, the family spent equal amounts of money on milk and fruits.
 ANSWER
0 Comments
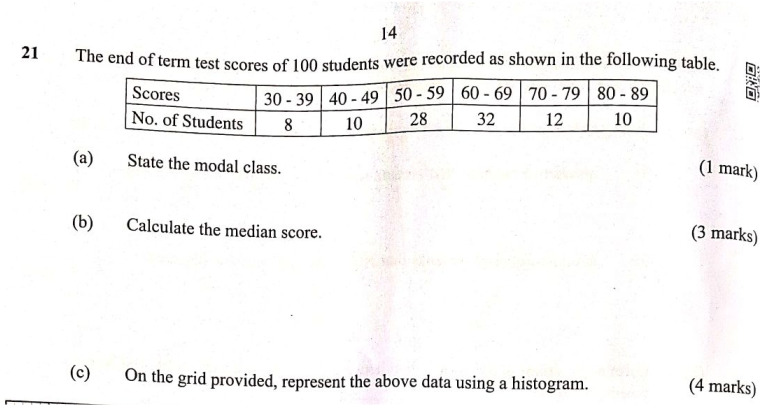
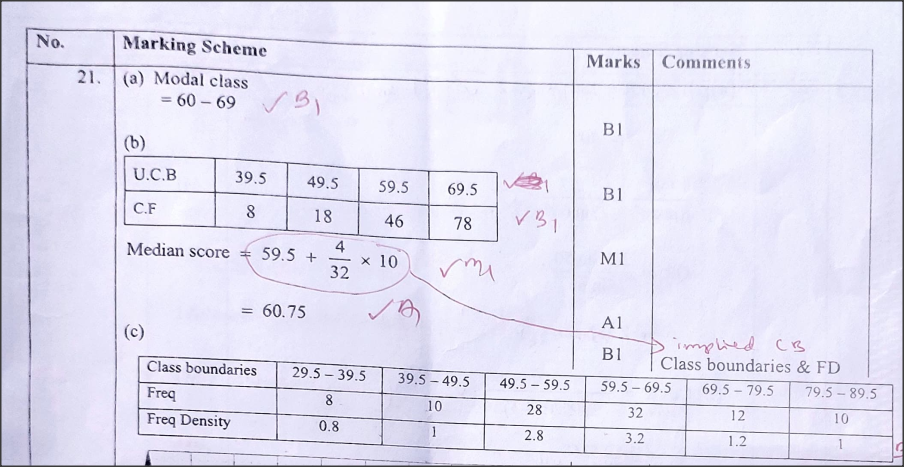
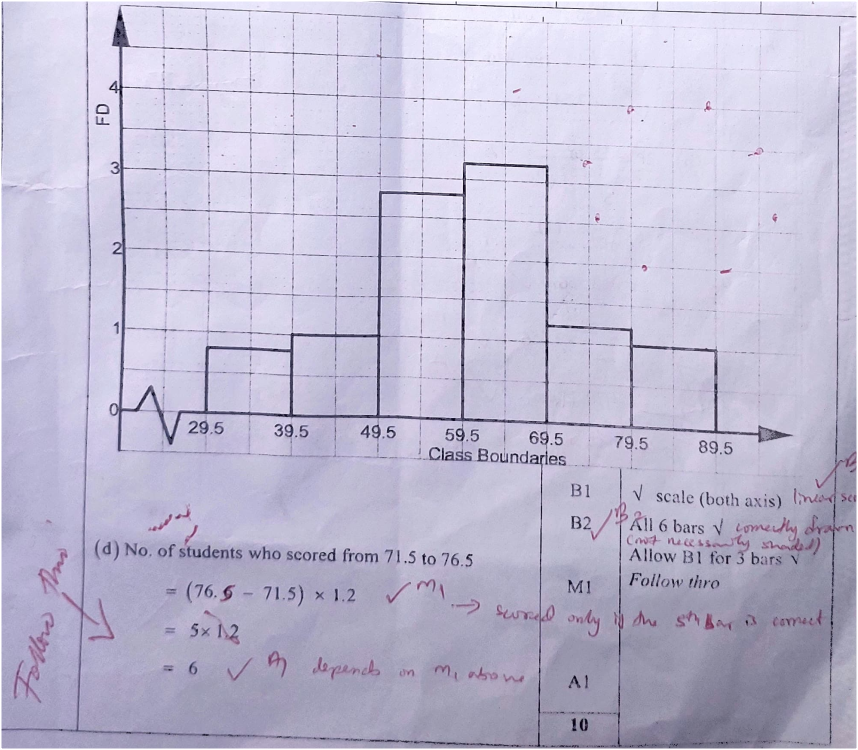
The end of term test scores of 100 students were recorded as shown in the following table.29/12/2023 QUESTION 21 | KCSE 2023 | STATISTICS I | PAPER 1 | FORM 2 LEVELThe end of term test scores of 100 students were recorded as shown in the following table.
QUESTION:
MARKING SCHEME:
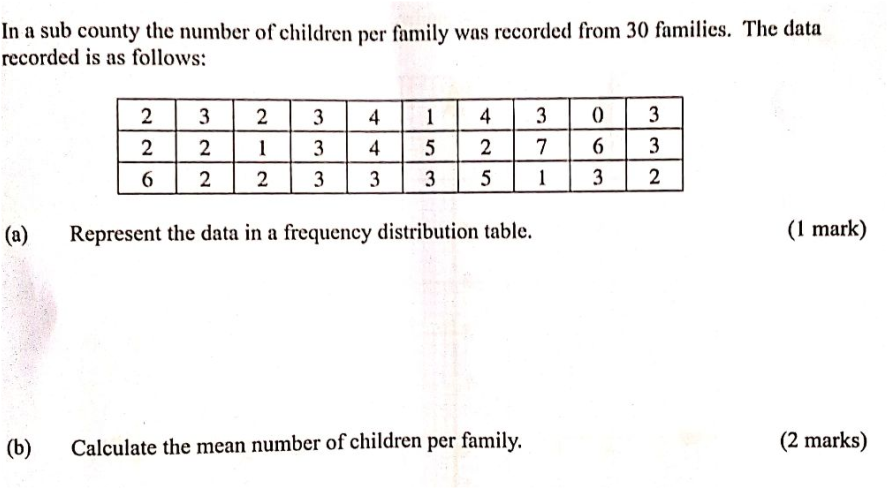
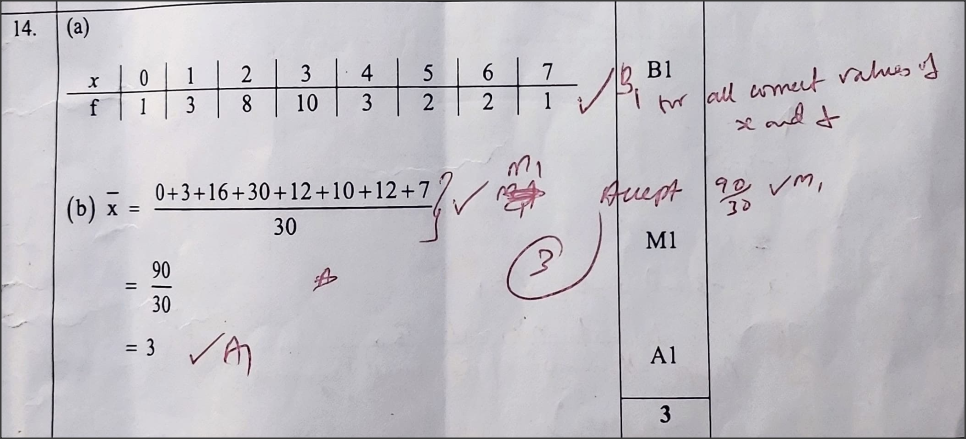
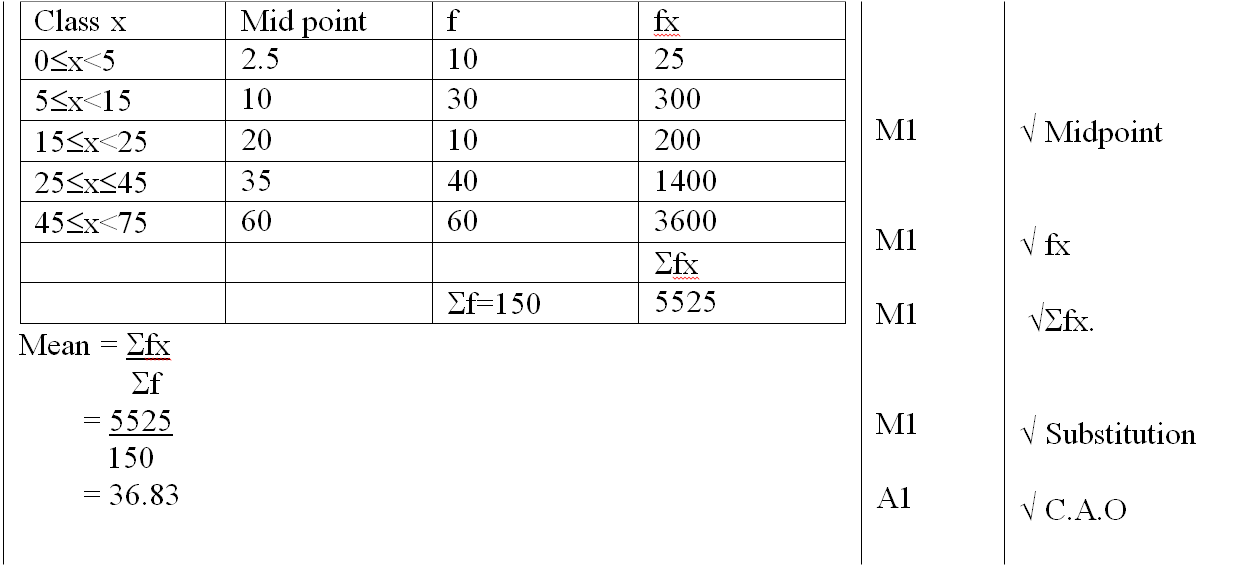
QUESTION 14 | KCSE 2023 | Statistics I | PAPER 1 | FORM 2 LEVELIn a sub county the number of children per family was recorded from 30 families. The data recorded is as follows: 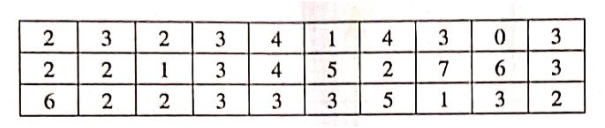 (a) Represent the data in a frequency distribution table. (1 mark) (b) Calculate the mean number of children per family. (2 marks) QUESTION:
MARKING SCHEME:
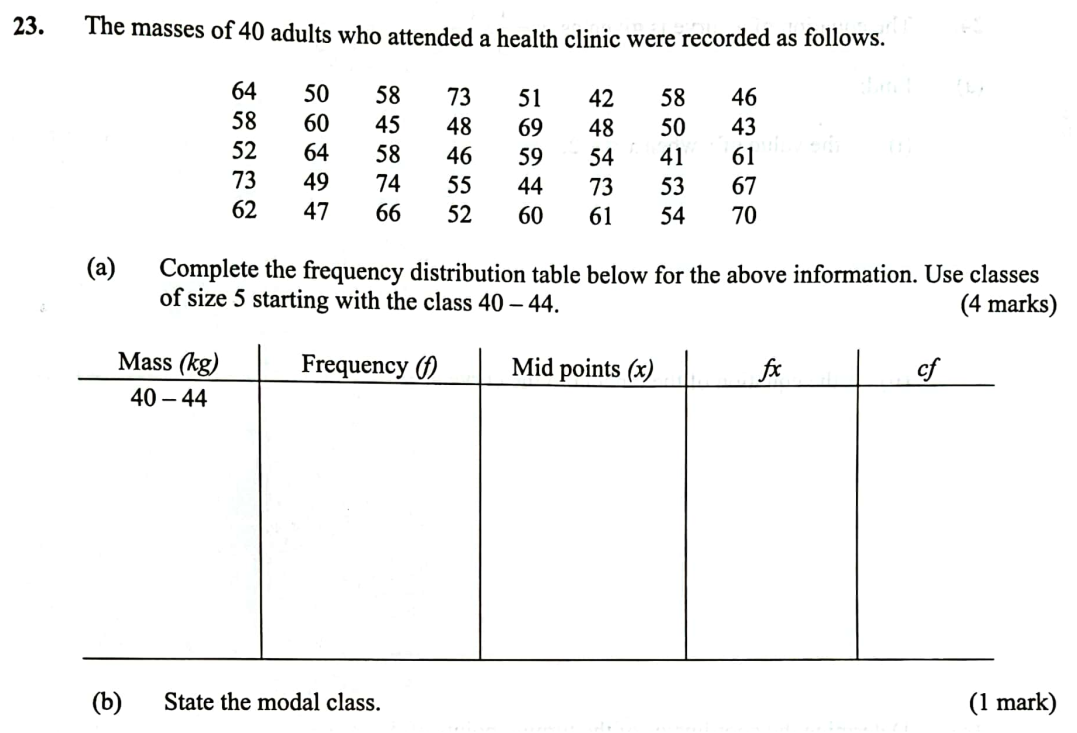
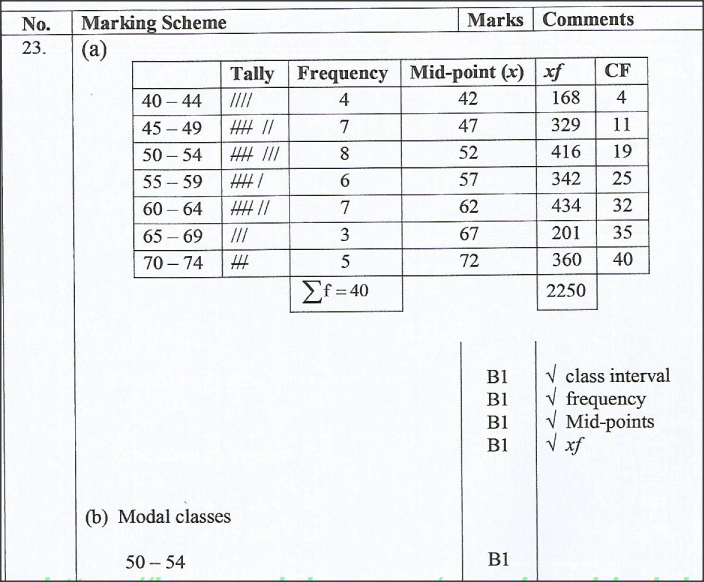
QUESTION 23 | KCSE 2021 | STATISTICS I | PAPER 1 | FORM 2 LEVELThe masses of 40 adults who attended a health clinic were recorded as follows. 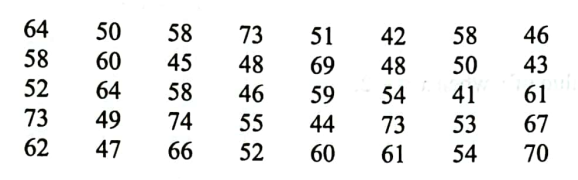 (a) Complete the frequency distribution table below for the above information. Use classes of size 5 starting with the class 40 - 44. (4 marks) 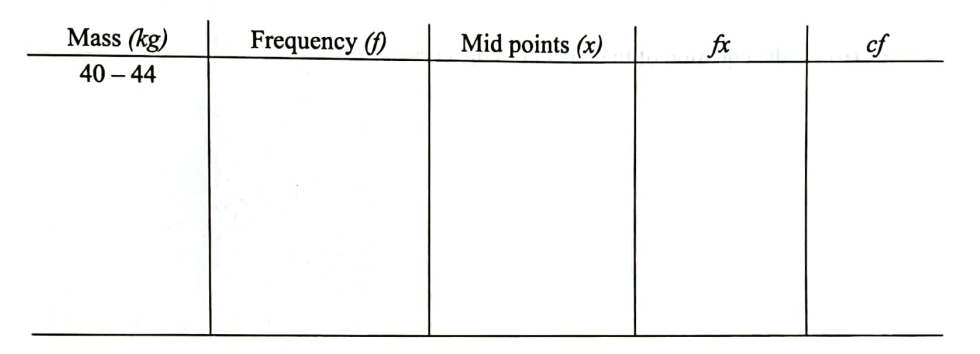 (b) State the modal class. (1 mark) (c) Estimate: (i) the mean mass. (2 marks) (ii) the median mass. (3 marks) QUESTION:
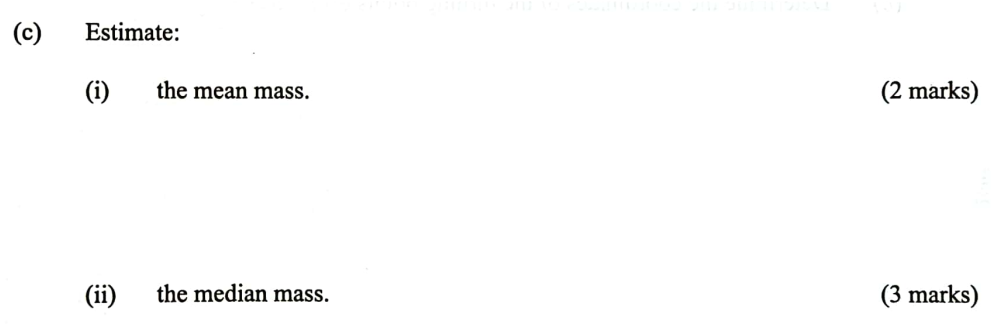
MARKING SCHEME:
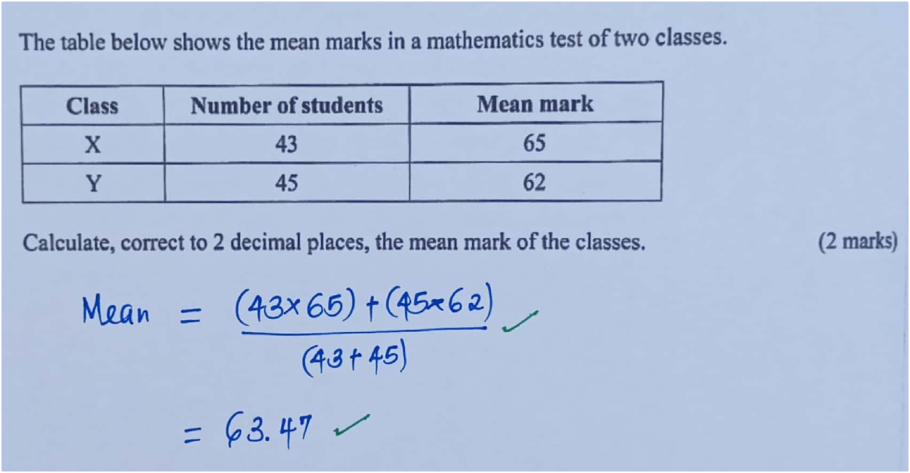
QUESTION 15 | KCSE 2022 | STATISTICS I | PAPER 1 | FORM 2 LEVELThe table below shows the mean marks in a mathematics test of two classes. Calculate, correct to 2 decimal places, the mean mark of the classes.  MARKING SCHEME
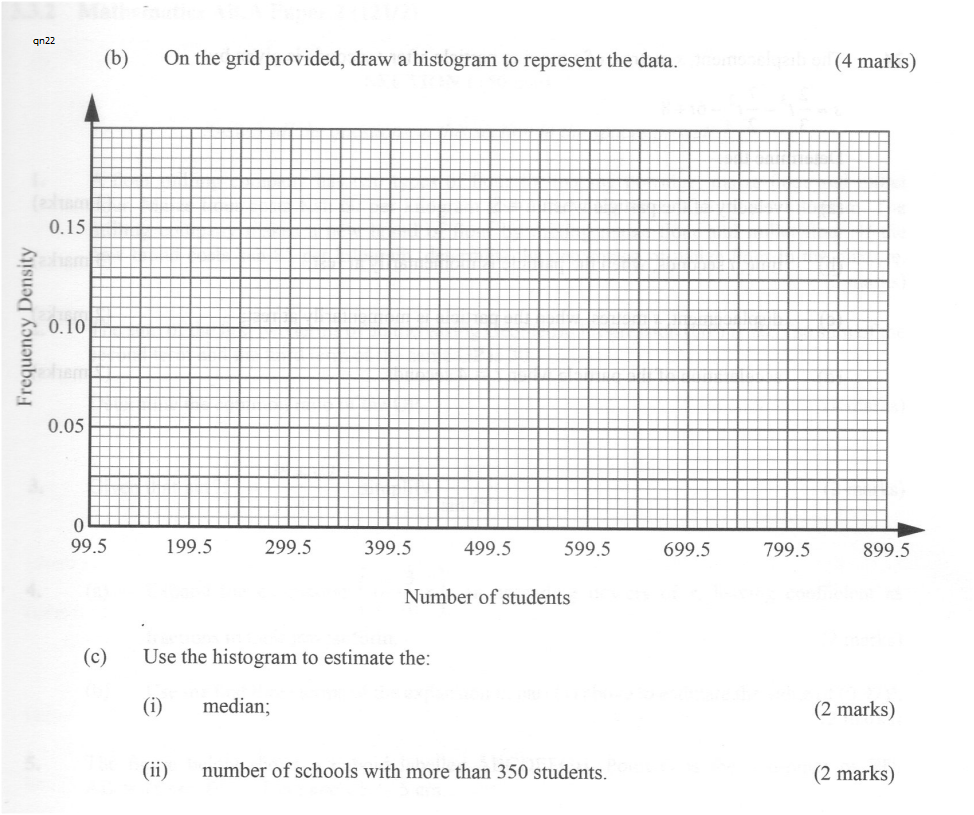
THE NUMBER OF STUDENTS IN 40 SCHOOLS IN A CERTAIN SUB-COUNTY WERE RECORDED AS FOLLOWS:
KCSE 2020 MATHEMATICS ALT A PAPER 1 QUESTION 22


The height of tree seedlings in a nursery were measured and recorded as in the table below11/5/2023 The height of tree seedlings in a nursery were measured and recorded as in the table below
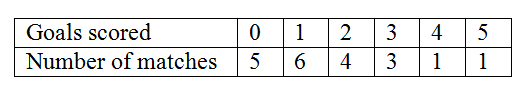
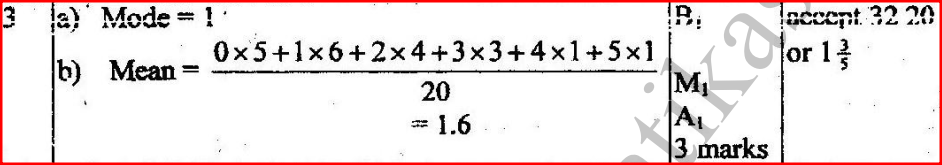
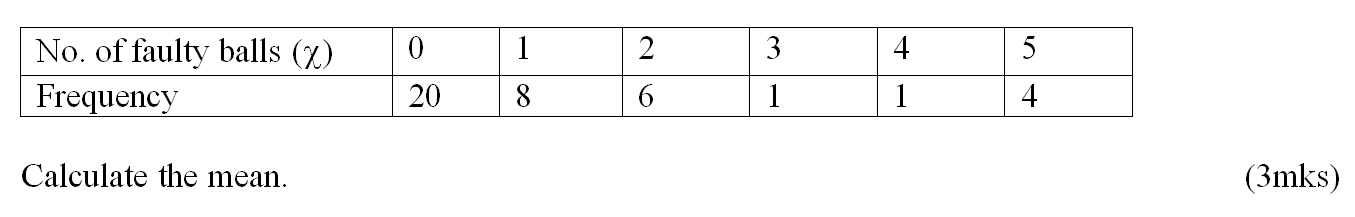
The table below shows the number of goals scored in 40 soccer matches during a certain season.19/11/2021 The table below shows the number of goals scored in 40 soccer matches during a certain season.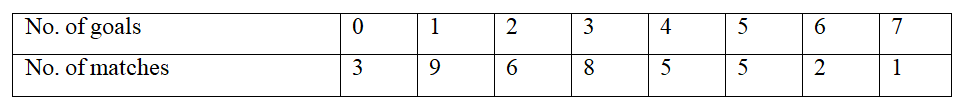
Calculate the mean number of goals scored per match. (3mks)Worked Solution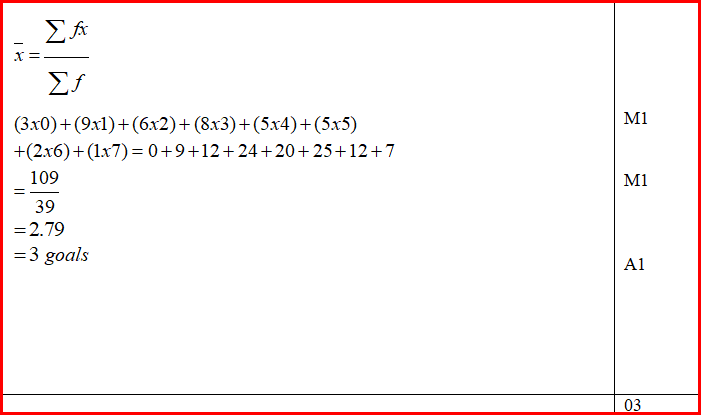
Form 4 Mathematics
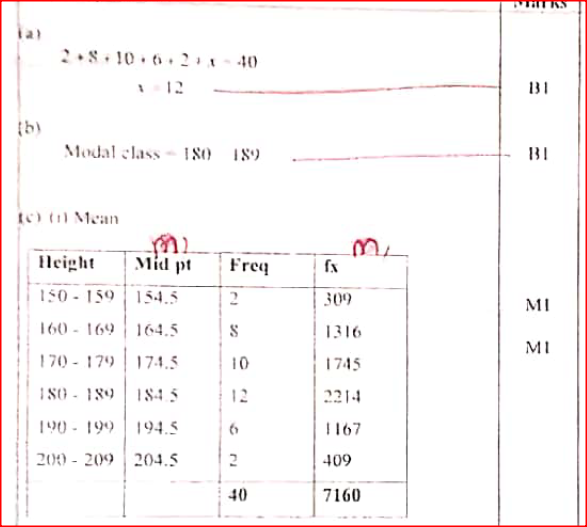
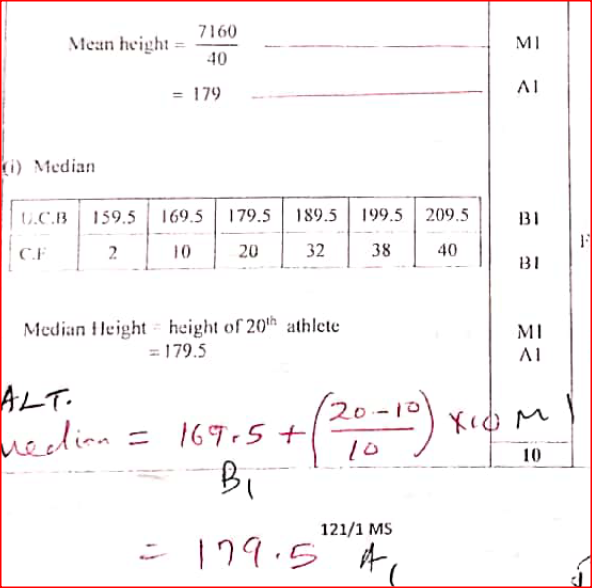
The heights of 40 athletes in a county athletics competition were as shown in the table below
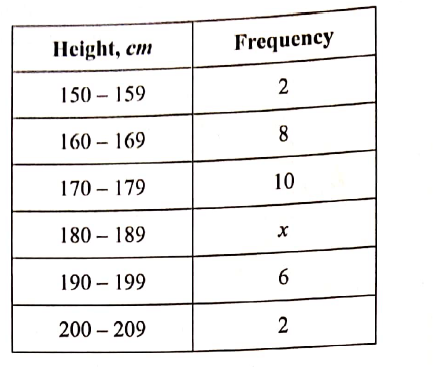
(a) Find the value of X.
(b) State the modal class. (c) Calculate: (i) The mean height of the athletes; (ii) The median height, correct to 1 decimal place,of the athletes
answers
Form 2 Mathematics
The masses, in kilograms, of patients who attended a clinic on a certain day were recorded follows.

(a) Starting with the class 35 — 39, make a frequency distribution table for the data.
(b) Calculate: (i) the mean mass; (ii)the median mass (c) On the grid provided below draw a histogram to represent the data
answers


Form 2 Mathematics
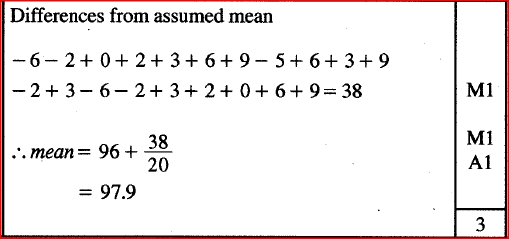
The masses in kilograms of 20 bags of maize were:
90, 94, 96, 98, 99, 102, 105, 91, 102, 99, 105, 94, 99, 90, 94, 99, 98, 96, 102 and 105. Using an assumed mean of 96 kg, calculate the mean mass, per bag of the maize.
ANSWER

Form 2 Mathematics
The production of milk, in litres, of 14 cows on a certain day was recorded as follows:
22, 26, 15, 19, 20, 16,27, 15, 19, 22, 21, 20, 22 and 28. Determine: (a) the mode; (b) the median.
answers

Form 2 Mathematics
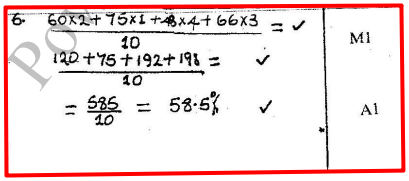
A students obtained the following marks in four tests during a school term: 60%, 75%, 48% and 66%. The tests were weighted as follows: 2,1, 4 and 3 respectively.
Calculate the students weighed mean mark of the tests
Answer
Form 2 Mathematics
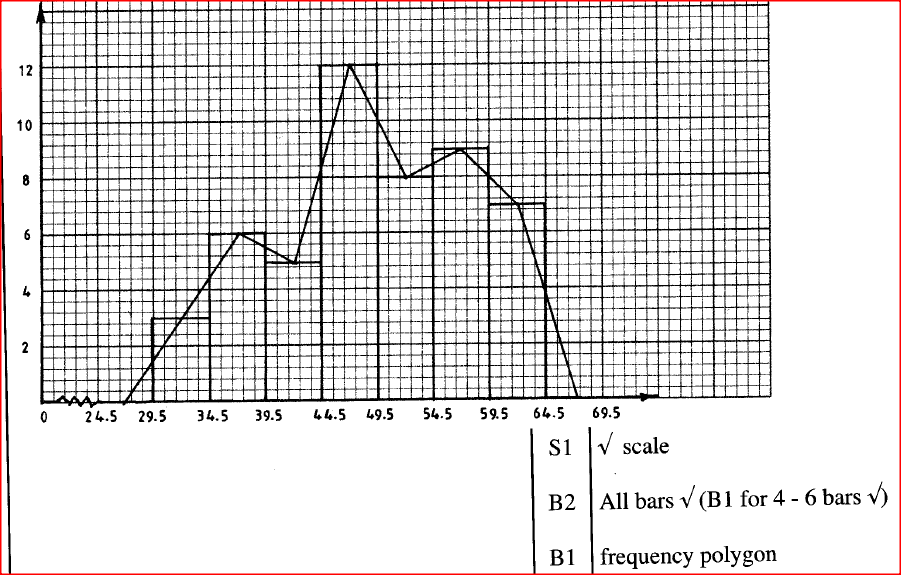
The marks scored by a group of students in a test were recorded as shown in the table below

On the grid provided, and on the same axes, represent the above data using
a) a histogram; b) a frequency polygon
answers
Form 3 Mathematics
The table below shows the frequency distribution of mks scored by students in a test.

Determine the median mark correct to 2 s.f.
answers

Form 2 Mathematics
The lengths, in cm, of pencils used by pupils in a standard one class on a certain day were recorded as follows.

(a) Using a class width of 3, and starting with the shortest length of the pencils, make a frequency distribution table for the data.
(b) Calculate: (i) The mean length of the pencils (ii) The percentage of pencils that were longer than 8cm but shorter than 15cm. (c) On the grid provided, draw a frequency polygon for the data
answers


Form 3 Mathematics
The table below shows the number of goals scored by a football team in 20 matches
Find:
ANSWER
Form 2 Mathematics
The masses in kilograms of 20 bags of maize were;
90, 94, 96, 98, 99, 102, 105, 91, 102, 99, 105, 94, 99, 90, 94, 99, 98, 96, 102 and 105. Using an assumed mean of 96kg, calculate the mean mass, per bag, of the maize.
answer
Form 2 Mathematics
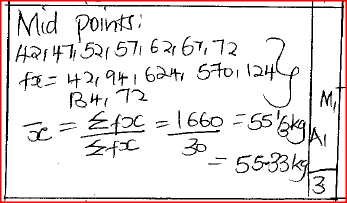
The table below shows the height, measured to the nearest cm, of 101 pawpaw trees.

(a) State the modal class.
(b) Calculate to 2 decimal places: (i) the mean height; (ii) the difference between the median height and the mean height.
answers


Form 2 Mathematics
The frequency table below shows the daily wages paid to casual workers by a certain company.

(a) Draw a histogram to represent the above information.
(b) (i) State the class in which the median wage lies. (ii) Draw a vertical line, in the histogram, showing where the median wage lies. (c) Using the histogram, determine the number of workers who earn sh 450 or less per day.
answers


Form 2 Mathematics
The masses of people during a clinic session were recorded as shown in the table below.

Calculate the mean mass.
answer
Form 2 Mathematics
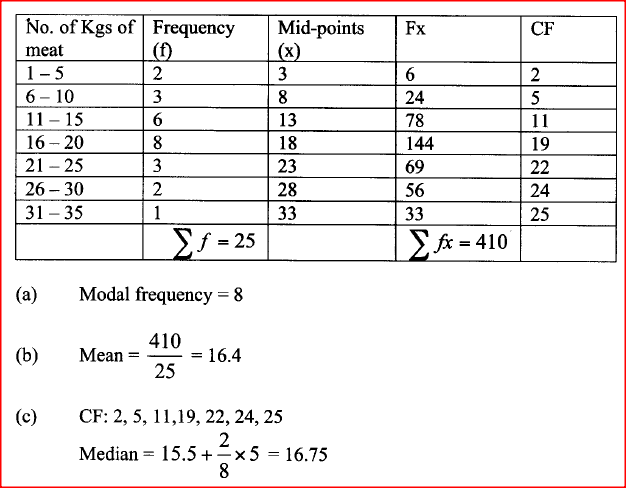
The frequency distribution table below represents the number of kilograms of meat sold in a butchery.
(a) State the modal frequency
(b)Calculate the mean mass. (c)Calculate the median mass.
answer
Form 2 Mathematics
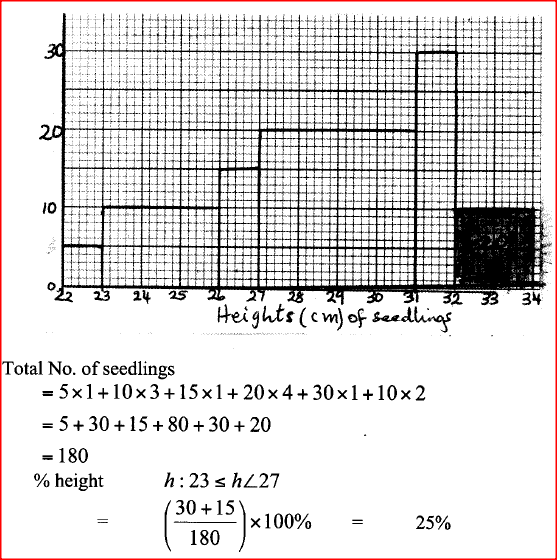
The histogram shown below represents the distribution of heights of seedlings of a certain plant.
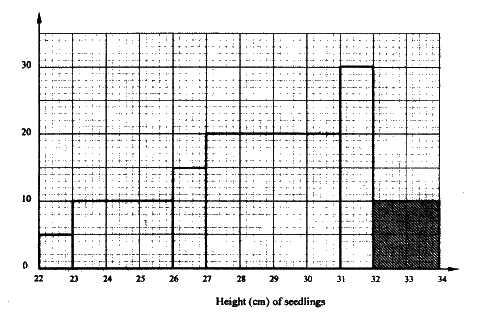
The shaded area in the histogram represents 20 seedlings. Calculate the percentage number of seedlings with heights of at least 23 cm but less than 27 cm.
answer
Form 2 Mathematics
The following data was obtained for the masses of certain animals.

Complete the histogram on the grid provided

answer
|

Categories
All
Archives
December 2024
Latest Posts |
|
Primary Resources
College Resources
|
Secondary Resources
|
Contact Us
Manyam Franchise
P.O Box 1189 - 40200 Kisii Tel: 0728 450 424 Tel: 0738 619 279 E-mail - sales@manyamfranchise.com |
 RSS Feed