K.C.S.E Physics Q & A - MODEL 1995PP2QN01
The data in the table below represents the motion of vehicle over a period of 7 second
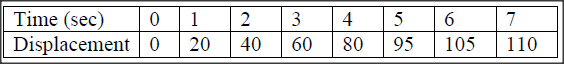
(a) plot on the grid provided, a graph of displacement ( y- axis) against time
(b) Describe the motion of the vehicle for the first 4 s (c) Determine the velocities at 4.5s and 6.5s. Hence or otherwise determine the average acceleration of the vehicle over this time interval
K.N.E.C MARKING SCHEME


0 Comments
Leave a Reply. |
CATEGORIES
Categories
All
Topics
FORM I - PHYSICS SYLLABUSFORM II - PHYSICS SYLLABUSTOPICS
FORM III - PHYSICS SYLLABUSFORM IV - PHYSICS SYLLABUSARCHIVES
RSS FEEDS
AUTHOR
M.A NyamotiMy passion is to see students pass using right methods and locally available resources. My emphasis is STEM courses
|
 RSS Feed