K.C.S.E Physics Q & A - MODEL 2007PP2QN11&12
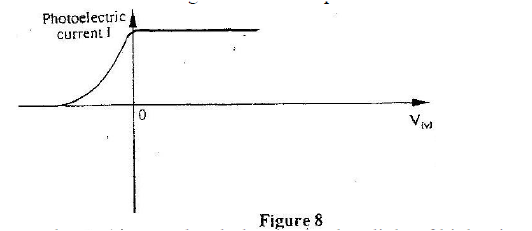
The graph in figure 8 shows the variation of photoelectric current with applied voltage when a surface was illuminated with light of a certain frequency. Use the information in the figure to answer questions 11 and 12
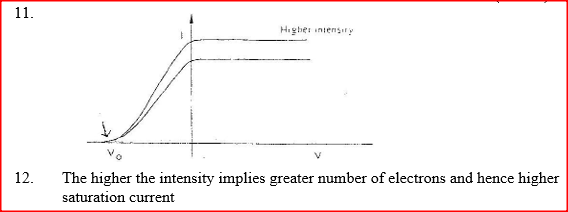
On the same axes, sketch the graph when light of higher intensity but same frequency is used to illuminate the surface.
Explain your answer in 11 above
ANSWERS
0 Comments
Leave a Reply. |
CATEGORIES
Categories
All
Topics
FORM I - PHYSICS SYLLABUSFORM II - PHYSICS SYLLABUSTOPICS
FORM III - PHYSICS SYLLABUSFORM IV - PHYSICS SYLLABUSARCHIVES
RSS FEEDS
AUTHOR
M.A NyamotiMy passion is to see students pass using right methods and locally available resources. My emphasis is STEM courses
|
 RSS Feed