|
KCSE Geography Paper 2 2008 Section B Question 7. a) i) Give two documents from where information on population data is obtained
ii) The pyramid below represents population structure Kenya. 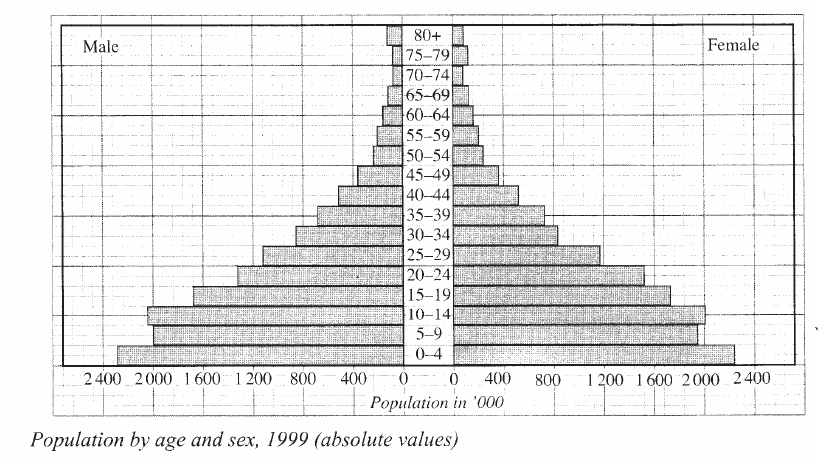 Describe the characteristics of the population as represented by the pyramid.
b) i) In 1989 Kenya population was 21.4 million while in 1999 it was 28.7 million. Calculate the population was 21.4 million. Calculate the population growth rate over the 10 year period. (Show your calculations) ii) Explain two factors which may have led to the large population increase between 1989 and 1999.Early marriages.
c) Explain three consequences of high population growth rate.
d) Explain four physical factors that influence population distribution in East Africa.Climate:
Related Geography Searches on Population Form 4 Level
0 Comments
Leave a Reply. |

Archives
March 2024
Categories
All
|
 RSS Feed