|
KCSE Geography Paper 2 2006 Section B Question 6. The graph below shows percentage value of some export commodities from Kenya between 1999 and 2003. Use it to answer questions (a) and (b)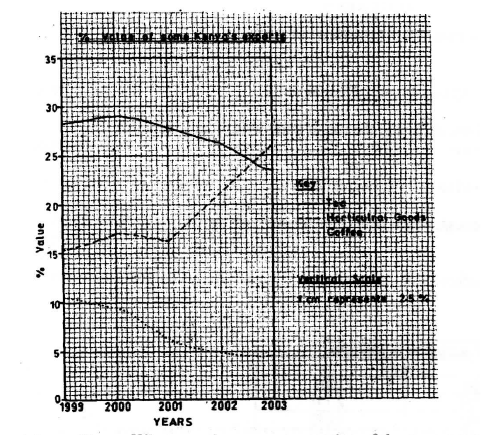 (a) (i) What was the percentage value of the tea exported in the year 2000?
(ii) What was the difference in the percentage values of the horticultural products and coffee exports in 1999?
(iii) Describe the trend of the value of coffee exports from 1999 to 2003
(iv) Explain three factors which may have led to the increased export earnings from horticultural produce in Kenya between years 1999 and 2003
(v) Give three advantages of using simple line graphs to represent data.
(b) State four reasons why Kenya’s agricultural export earnings are generally low
(c) State five reasons why the common market for Eastern and southern Africa
Related Geography Searches on statistical methods Form 3 Level
0 Comments
Leave a Reply. |
Archives
March 2024
Categories
All
|
 RSS Feed