|
KCSE Geography Paper 2 2004 Section B Question 6. The table below shows four principal crops produced in Kenya in the years 2000 2001. Use it to answer question(a) and (b).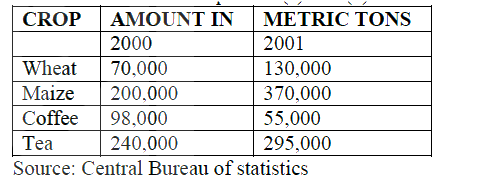 a) (i) Using a scale of 1 cm to represent 50,000 metric tons, draw a simple comparative bar graph based on the data above.(ii) State two advantages of using comparative bar graphs
b) Calculate the percentage increase in wheat production between the years 2000 and 2001.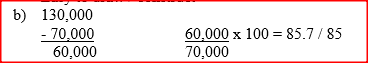 c) State five physical conditions required for the growing of tea in Kenya
d) Explain four problems experienced in small scale tea farming in Kenya
Related Geography Searches on statistical methods Form 3 Level
0 Comments
Leave a Reply. |
Archives
March 2024
Categories
All
|
 RSS Feed