|
KCSE Geography Paper 2 2013 Section B Question 6. The table below shows the approximate population size of four districts in Nairobi in the year 2009. Use it to answer question (a).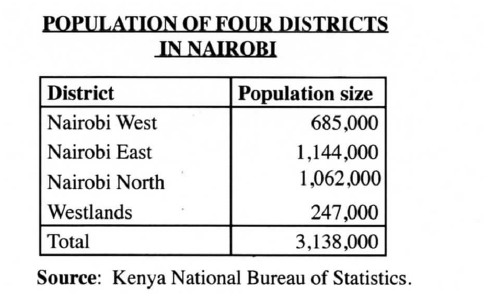 (a)(i)Apart from pie-chart, name two other statistical methods that can be used to represent the data in the table.
Using a radius of 5 cm, draw a pie chart to represent the data above. Show your calculations.  Calculate the populations growth rate of Nairobi over 10 year period if the population was approximately 2,143,000 in 1999. (b)Explain two factors which may have led to the large population increase in Nairobi between 1999 and 2009.
(c)Explain four positive effects of low population growth in a country.
Related Geography Searches on statistical methods Form 2 Level
0 Comments
Leave a Reply. |

Archives
March 2024
Categories
All
|
 RSS Feed