|
KCSE Geography Paper 2 2005 Section B Question 6. The table below shows the approximation of four districts in central province in 1999. Use it to answer question (a)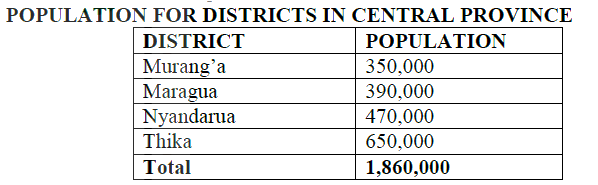 (a) (i) Suggest two possible reasons why the population of Thika is higher than that of Murang’a
(ii) Using a radius of 5 cm, draw a pie chart to represent the data above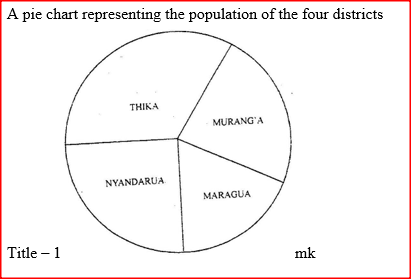 (iii) A part from pie charts, name two other statistical methods that can be used to represent the data in the table.
b) i) Give three advantages of using a pie chart to represent data
ii) State three reasons why it is necessary for a country to carry our population census.
c) Explain how the following factors have led to the population increase in Kenya. i. Early, marriages
Related Geography Searches on statistical methods Form 3 Level
0 Comments
Leave a Reply. |

Archives
March 2024
Categories
All
|
 RSS Feed