GEOGRAPHY TOPICAL QUESTIONS AND ANSWERS
|
KCSE Geography Paper 2 1996 Section B Question 1. The table below shows the number of passengers that used railway transport in the selected countries in 1966 and 1977. Use it to answer question (a) and (b)a) i) Using a scale of 1cm to represent 20,000 millions passengers , draw comparative bar graphs based on the data above (9mks) ii) State two advantages of using bar graphs in presenting data
b) Calculate the percentage decline in railway passenger transport in Canada between 1966 and 1977. (2mks)c) Explain why there are few railway links among African countries (6mks)
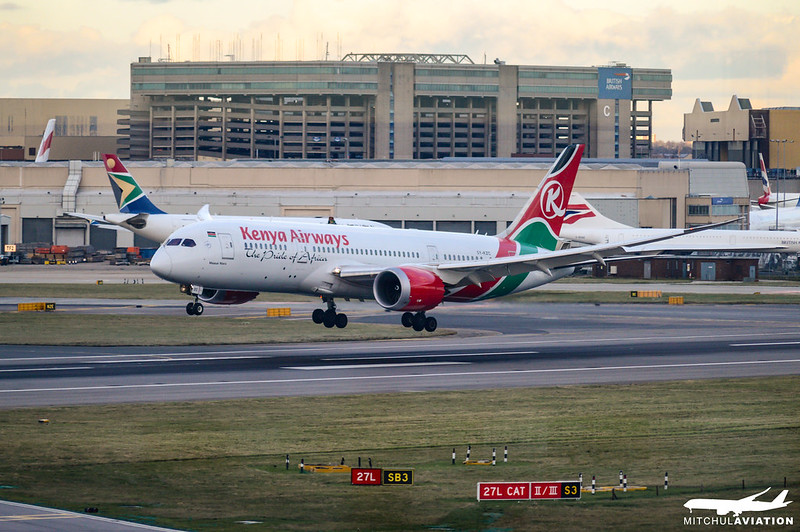
d) Explain three ways through which Kenya has benefited from her international airports.
Related Searches
0 Comments
Leave a Reply. |
Archives
March 2024
Categories
All
|
We Would Love to Have You Visit Soon! |
Hours24 HR Service
|
Telephone0728 450425
|
|
8-4-4 materialsLevels
Subjects
|
cbc materialsE.C.D.E
Lower Primary
Upper Primary
Lower Secondary
Upper Secondary
|
teacher support
Other Blogs
|


 RSS Feed