|
KCSE Geography Paper 2 2017 Section A Question 6. The table below shows the number of visitors in ‘000 to selected national parks in Kenya for the years 2006 to 2008. Use it to answer the questions that follow.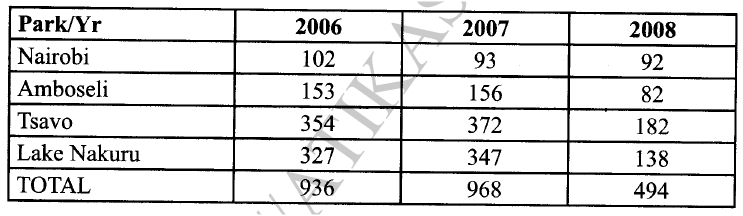 (a) (i) What is the difference in the number of visitors who visited the parks in 2006 and those in 2008. (ii) Calculate the percentage increase in the number of visitors who visited Lake Nakuru National Park between 2006 and 2007.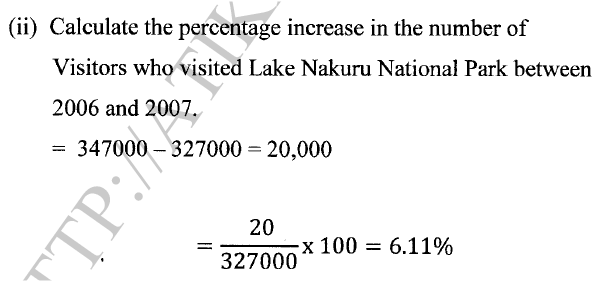 (b) (i) Draw a compound bar graph to represent the number of visitors to selected national parks in Kenya. Use the scale of 1 cm to represent 100,000 visitors.Compound Bar graph Representing visitors to selected National Parks in Kenya 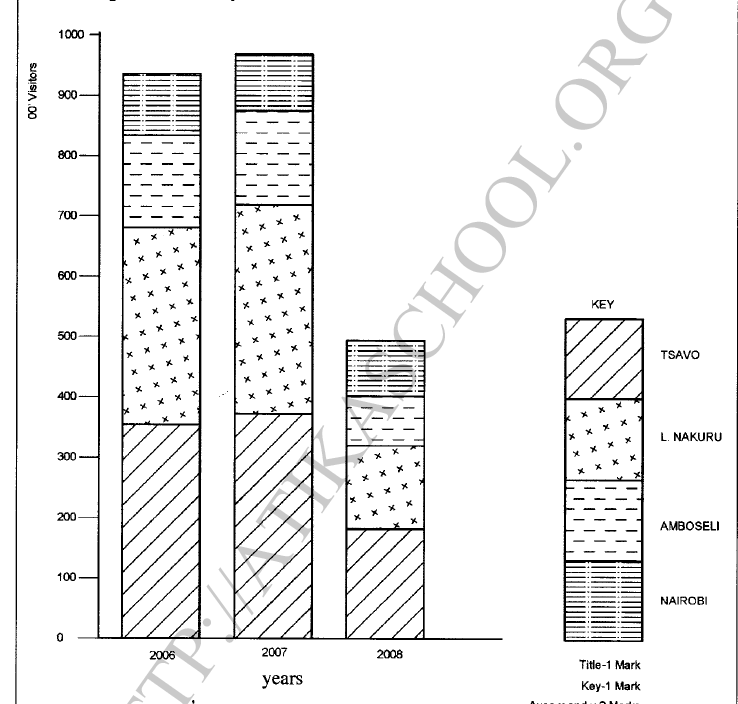 (ii) State three advantages of using compound represent geographical data.
(c) Explain four problems associated with tourism in Kenya.
Related Geography Searches on Statistical Methods Form 2 Level
0 Comments
Leave a Reply. |

Archives
March 2024
Categories
All
|
 RSS Feed