The table below shows the value of Kenyans imports and exports in 1999.Use it to answer questions(a)26/2/2021 KCSE Geography Paper 2 2003 Section B Question 6. The table below shows the value of Kenyans imports and exports in 1999.Use it to answer questions(a) 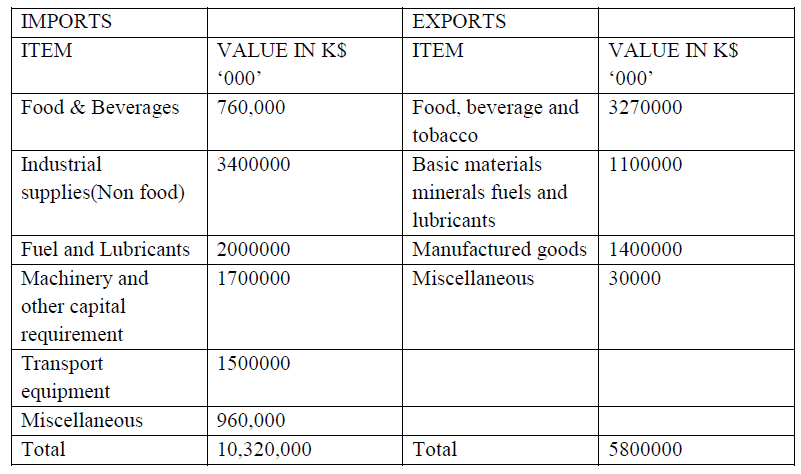 a) Use a radius of 5cm, draw a pie chart to represent data on exports shown on the table above. Show your calculations.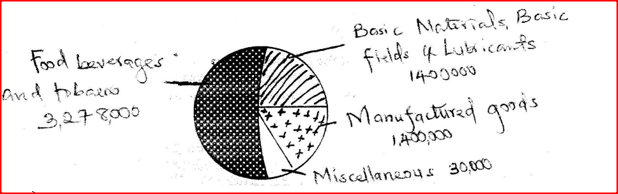 b) Explain four measures, which Kenya may take to reduce the unfavourable balance of trade.
c) Explain four benefits that Kenya derives from international trade.
Related Geography Searches on statistical methods Form 3 Level
0 Comments
Leave a Reply. |
Archives
March 2024
Categories
All
|
 RSS Feed