|
KCSE Geography Paper 1 2003 Section B Question 8. The tables below represent rainfall and temperature of stations X and Y. Use them to answer questions (a) and (b) 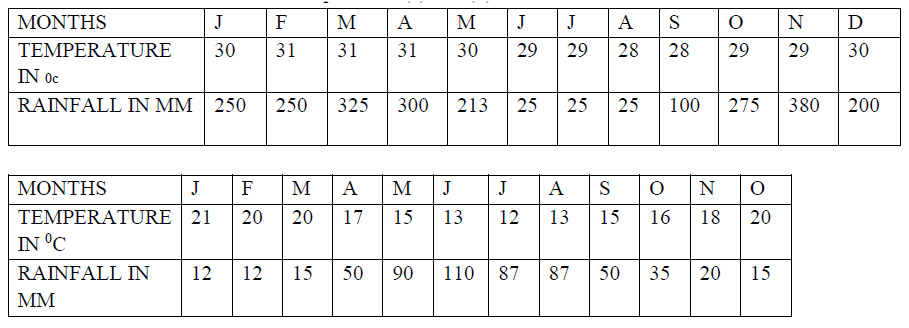 a) (i) for each of the two stations calculate the mean annual temperature.
(ii) Calculate the annual rainfall for station Y
(iii) On the graph paper provided, draw a bar graph to represent rainfall for station x. Use vertical scale of 1cm to represent 50mmb) Describe the climatic characteristics of station Y.
c)(i) Describe how conventional rainfall in the lake region of Kenya
Related Geography Searches on Climate Form 2 Level
0 Comments
Leave a Reply. |
Archives
March 2024
Categories
All
|
 RSS Feed