|
KCSE Geography Paper 2 2019 Section B Question 6. Use the table below to answer the following questions: Kenya's agricultural production in 1000 tonnes between 2008 and 2011.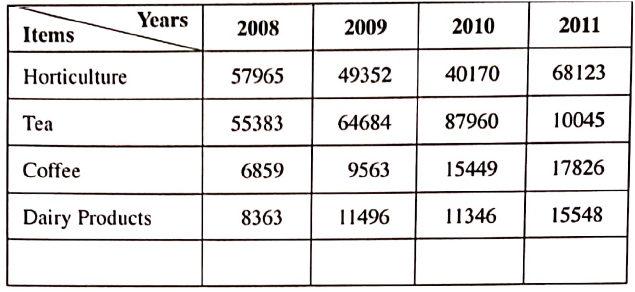 (a) (i) Apart from comparative Line graph, name four other methods that can be used to represent the above data.
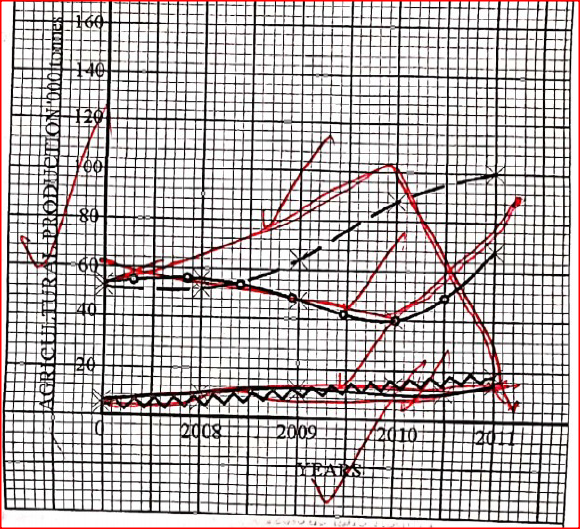
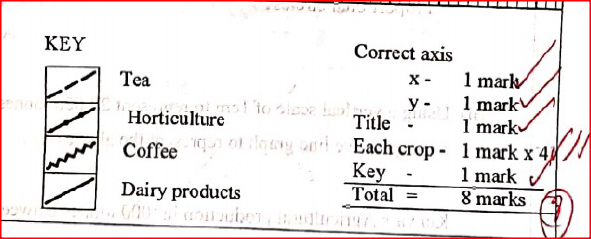
(ii) Using a vertical scale of 1 cm to represent 20,000 tonnes, draw a comparative line graph to represent the above data. |
Archives
March 2024
Categories
All
|
 RSS Feed